




The UK gender pay gap by occupation 2026 figures can help you prepare better questions about pay and progression. First, however, you need a matching comparison. An occupational median cannot establish what a colleague earns or what your employer should pay you.
Checked 27 October 2026. Our audit compares the official nine-occupation chart download with the accompanying workbook. Seven values agree. Two differ. We retain both versions below, alongside a practical comparator worksheet, rather than hiding the differences behind a ranking.
What the headline measures
The ONS release of 22 October measures April 2026. Its provisional full-time gap is 6.8%, compared with 7.2% in April 2025. It compares men’s and women’s median hourly earnings excluding overtime.
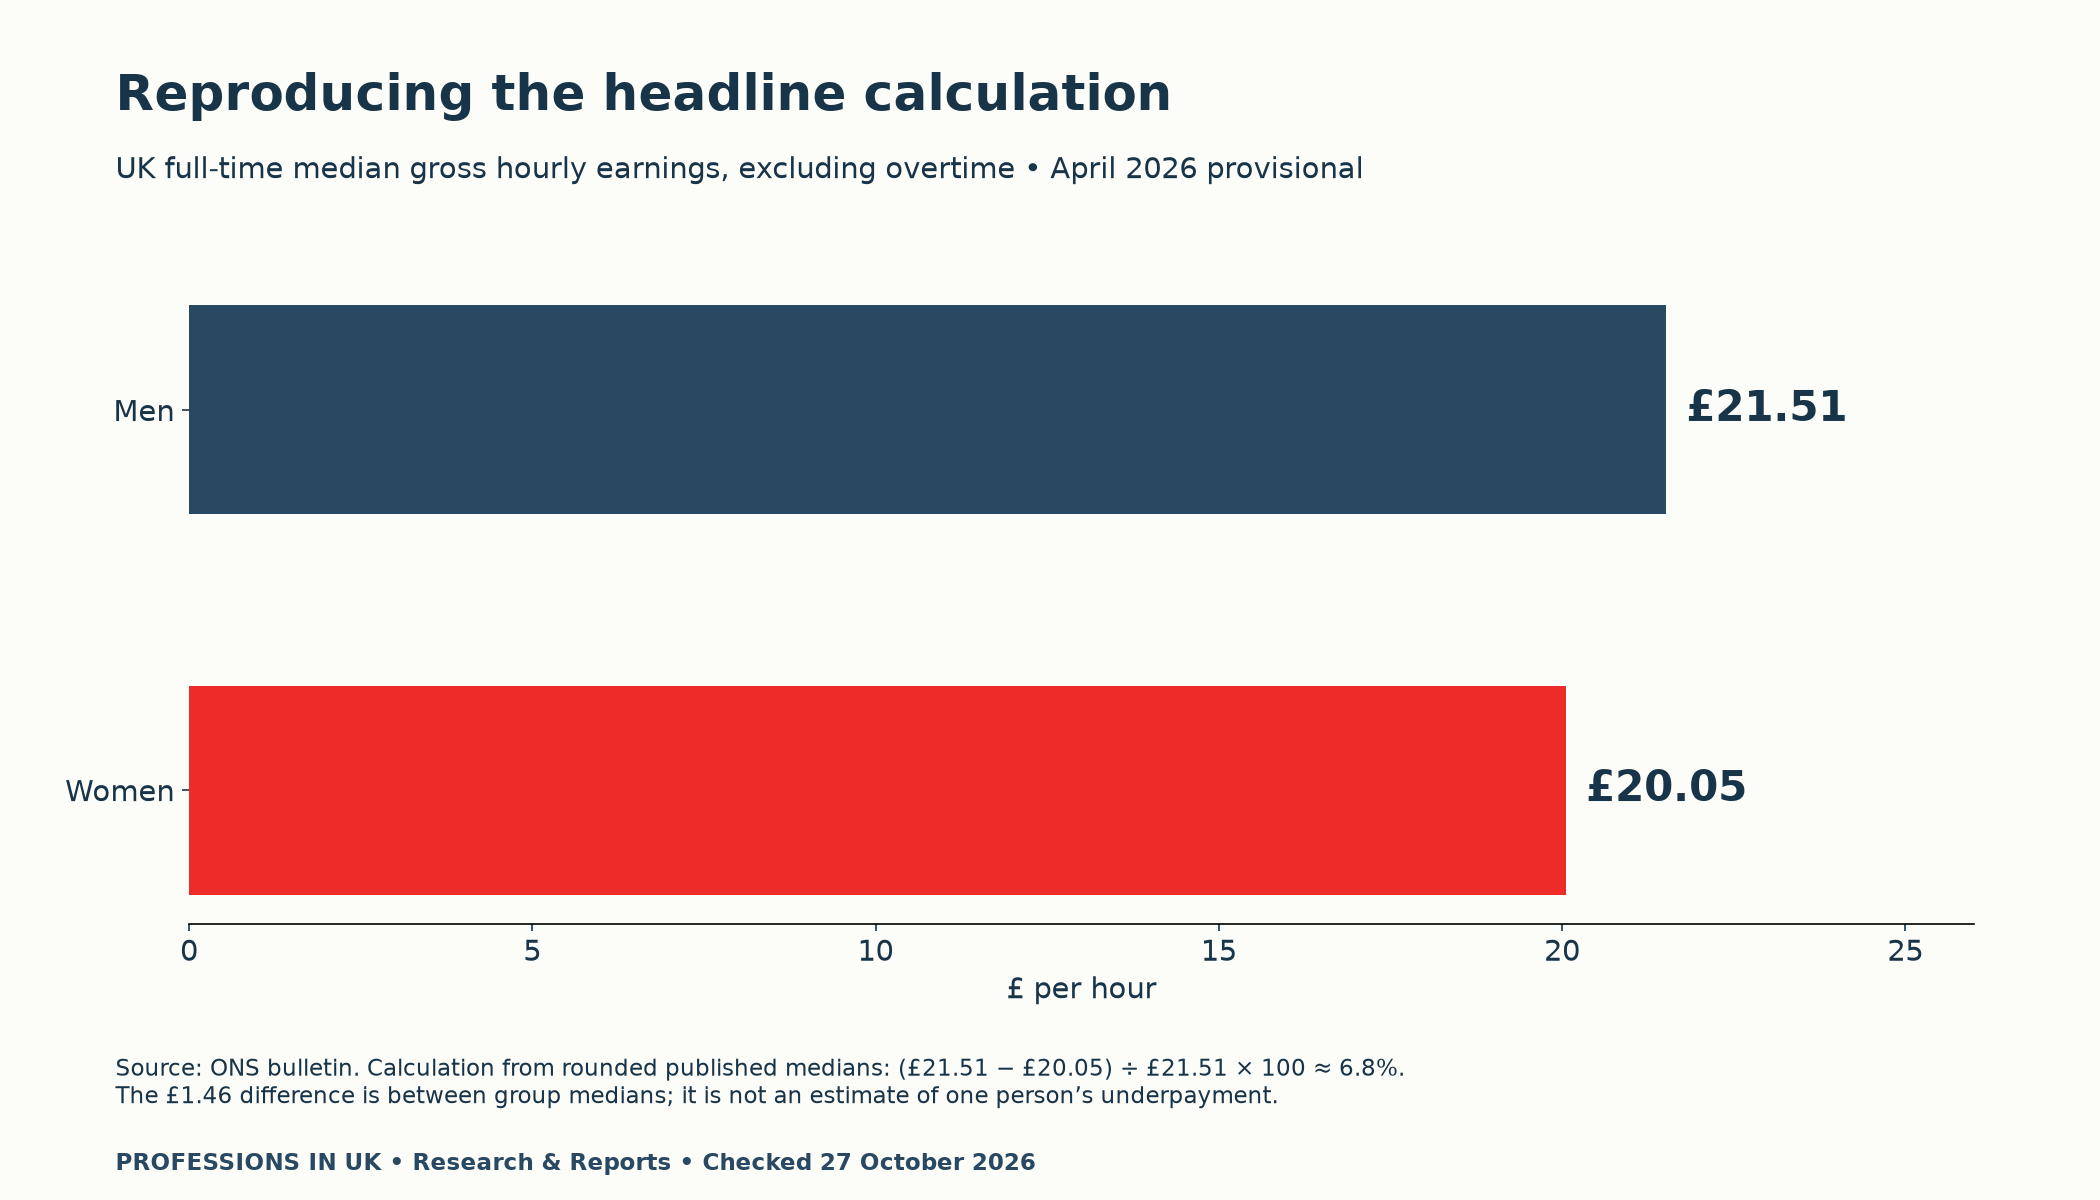
The published medians are £21.51 for men and £20.05 for women. Subtracting gives £1.46. Then divide by £21.51 and multiply by 100: approximately 6.8%. This reproduces the headline using rounded inputs. It does not calculate a particular person’s loss.
A useful question is: “What does this measure tell me about the comparison I want to make?” Keep the national evidence beside your own role information. Do not substitute one for the other.
UK gender pay gap by occupation 2026: all nine groups
Figure 2 preserves the order and labels of the official Figure 5 CSV. Its red bars flag the two values that differ from Table 2.12’s full-time median column. Colour indicates a source discrepancy here, not a quality rating or a judgement about employers.
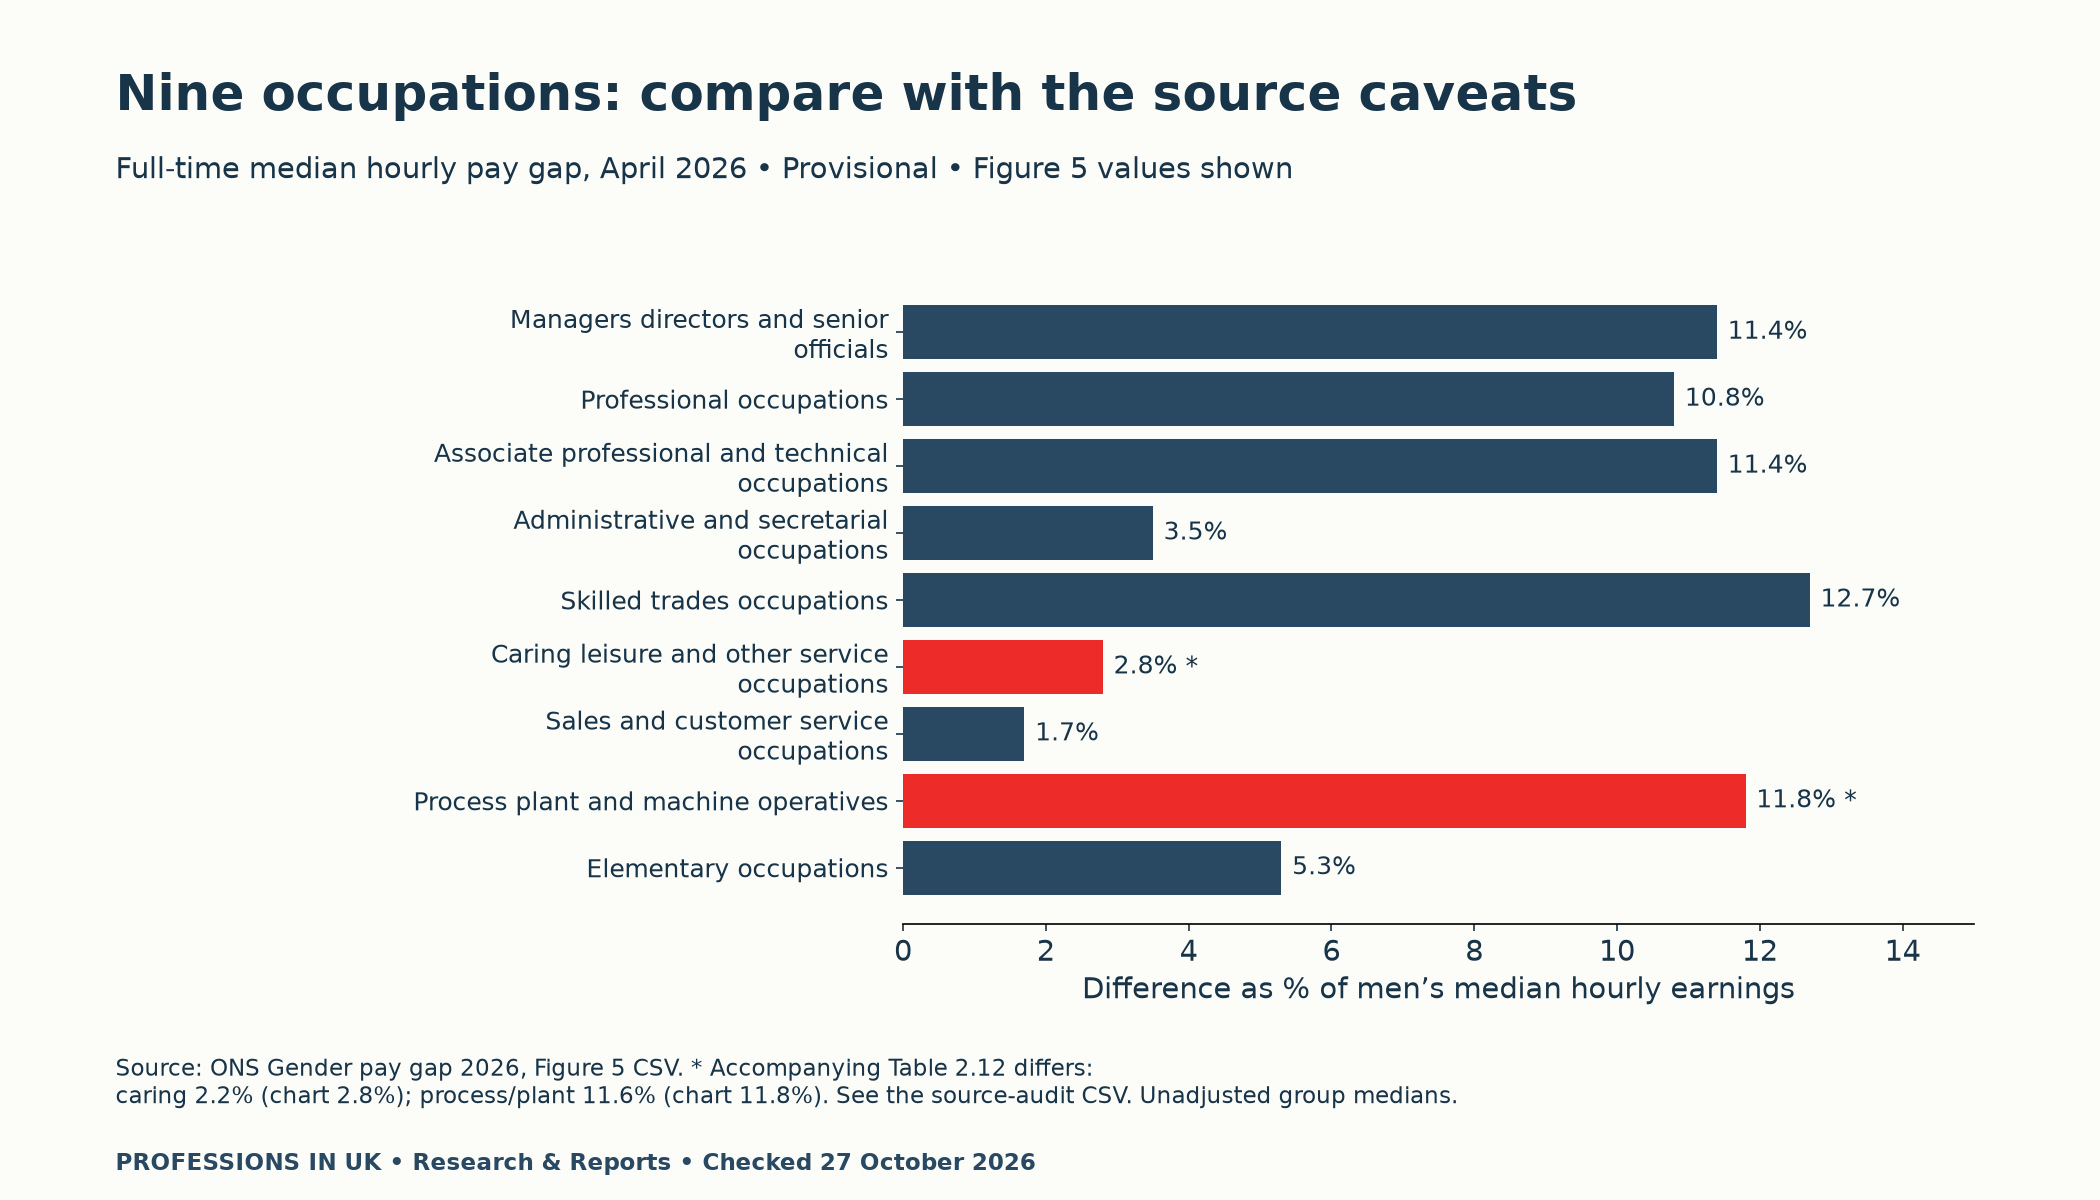
| SOC major code and Figure 5 label | Figure 5 (%) | Table 2.12 (%) | Audit |
|---|---|---|---|
| 1 — Managers directors and senior officials | 11.4 | 11.4 | values agree |
| 2 — Professional occupations | 10.8 | 10.8 | values agree |
| 3 — Associate professional and technical occupations | 11.4 | 11.4 | values agree |
| 4 — Administrative and secretarial occupations | 3.5 | 3.5 | values agree |
| 5 — Skilled trades occupations | 12.7 | 12.7 | values agree |
| 6 — Caring leisure and other service occupations | 2.8 | 2.2 | source discrepancy |
| 7 — Sales and customer service occupations | 1.7 | 1.7 | values agree |
| 8 — Process plant and machine operatives | 11.8 | 11.6 | source discrepancy |
| 9 — Elementary occupations | 5.3 | 5.3 | values agree |
The downloadable audit retains the chart label and workbook label separately, with the SOC 2020 major code. For example, the chart uses “Associate professional and technical occupations”; the workbook uses “Associate professional occupations” for code 3. Keeping the code and both labels makes that mapping visible.
Two values need a source check
The caring group is 2.8% in the chart CSV and 2.2% in the workbook. Process, plant and machine operatives are 11.8% and 11.6%, respectively. We checked both files on the same date. We have not established a cause or a corrected value.
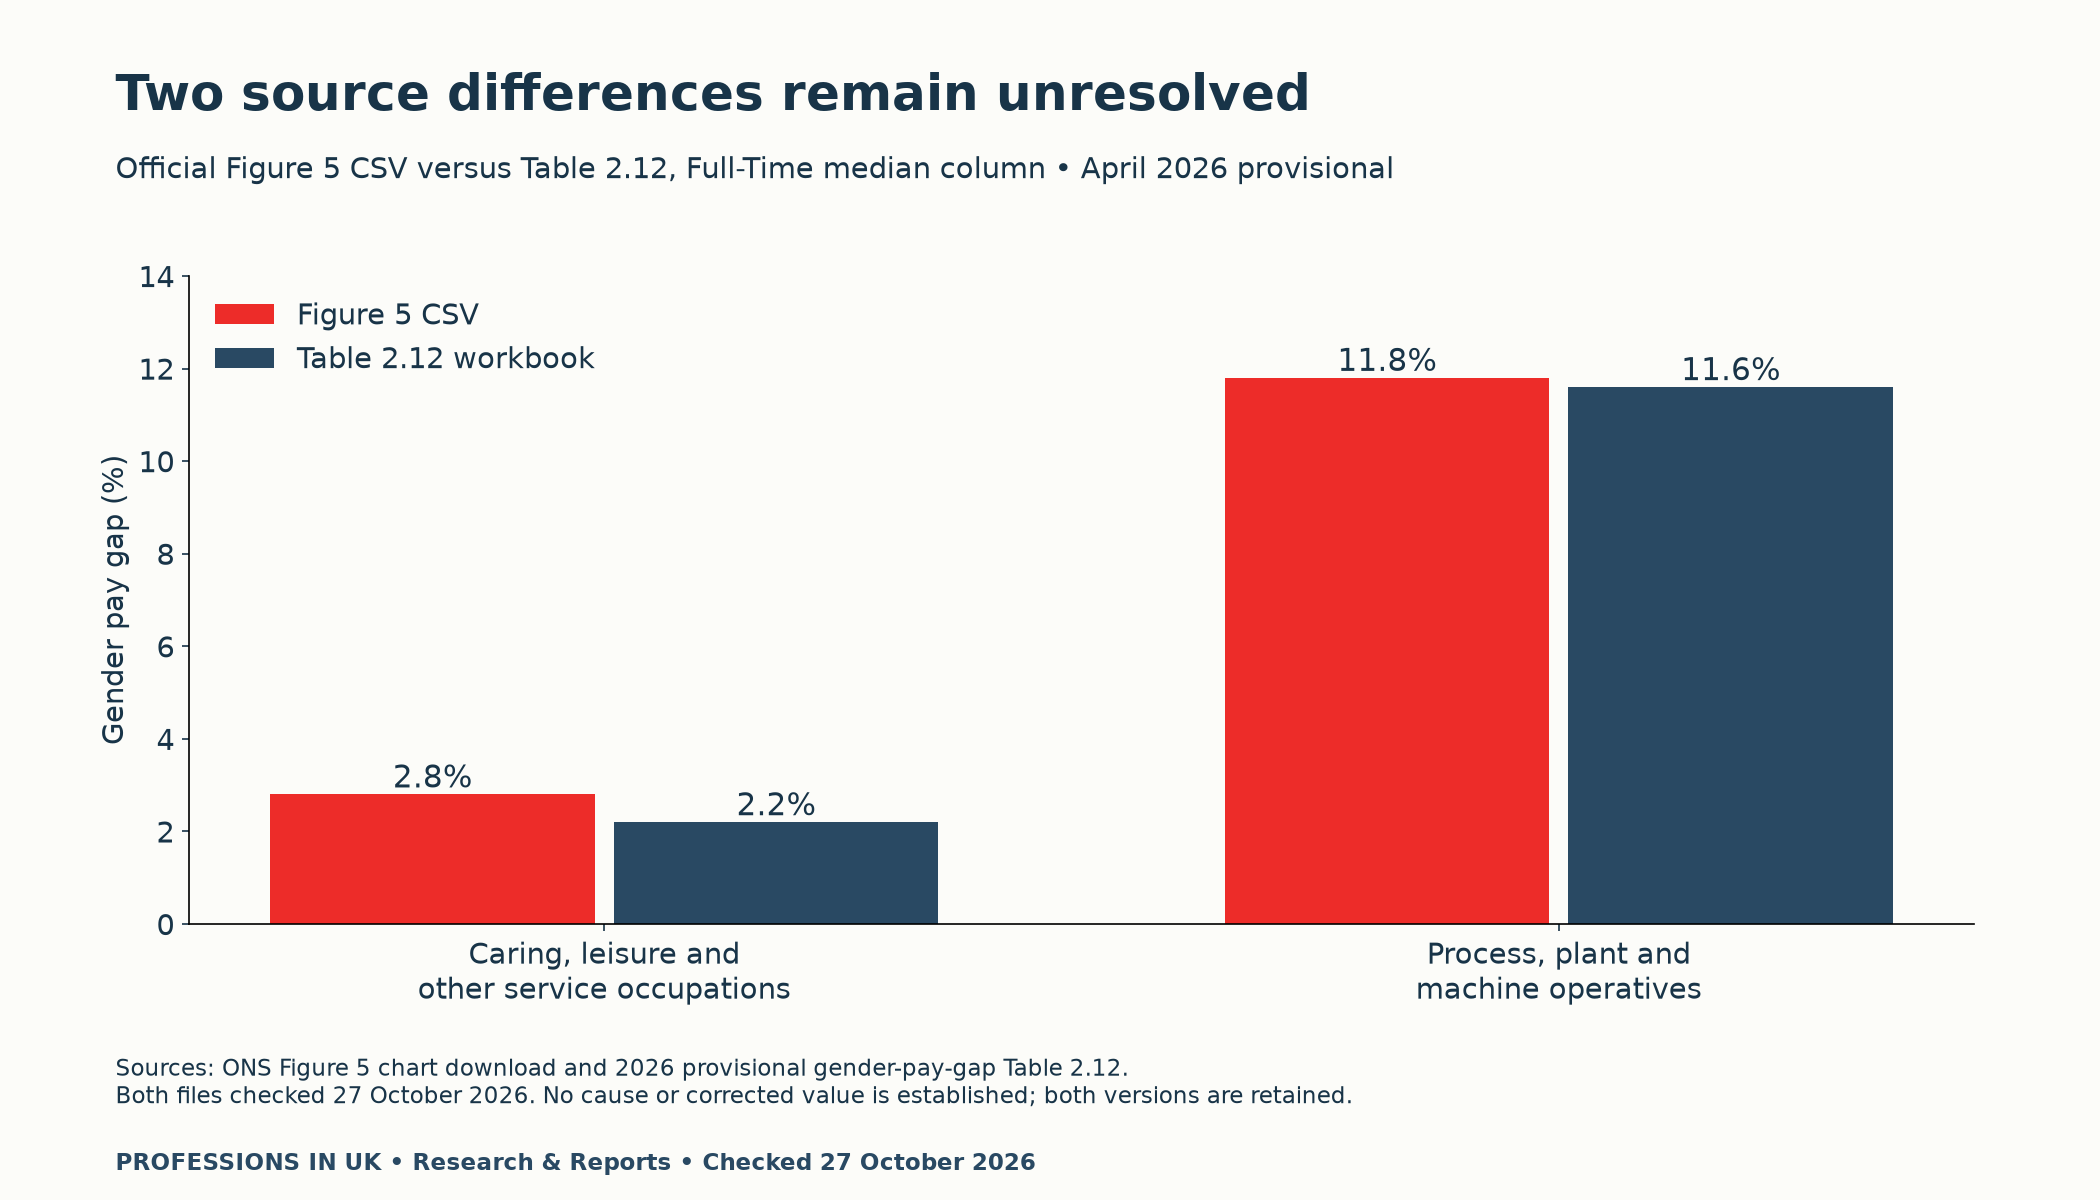
If either group is your comparator, carry both values into your notes and check for an ONS update before relying on one. Do not average them to manufacture a new estimate. That would conceal the discrepancy without resolving it.
This audit also checked the workbook’s quality formatting. All nine major-group median cells are white. The workbook defines that category as both underlying earnings estimates having coefficients of variation below 5%. None of those nine cells is suppressed. That quality information does not resolve the two file differences.
Choose the right working pattern and pay measure
The same release gives 12.3% for all employee jobs and negative 2.1% for part-time jobs. These compare different populations. A negative value means the women’s median is higher within that group. It does not mean every woman earns more than every man.
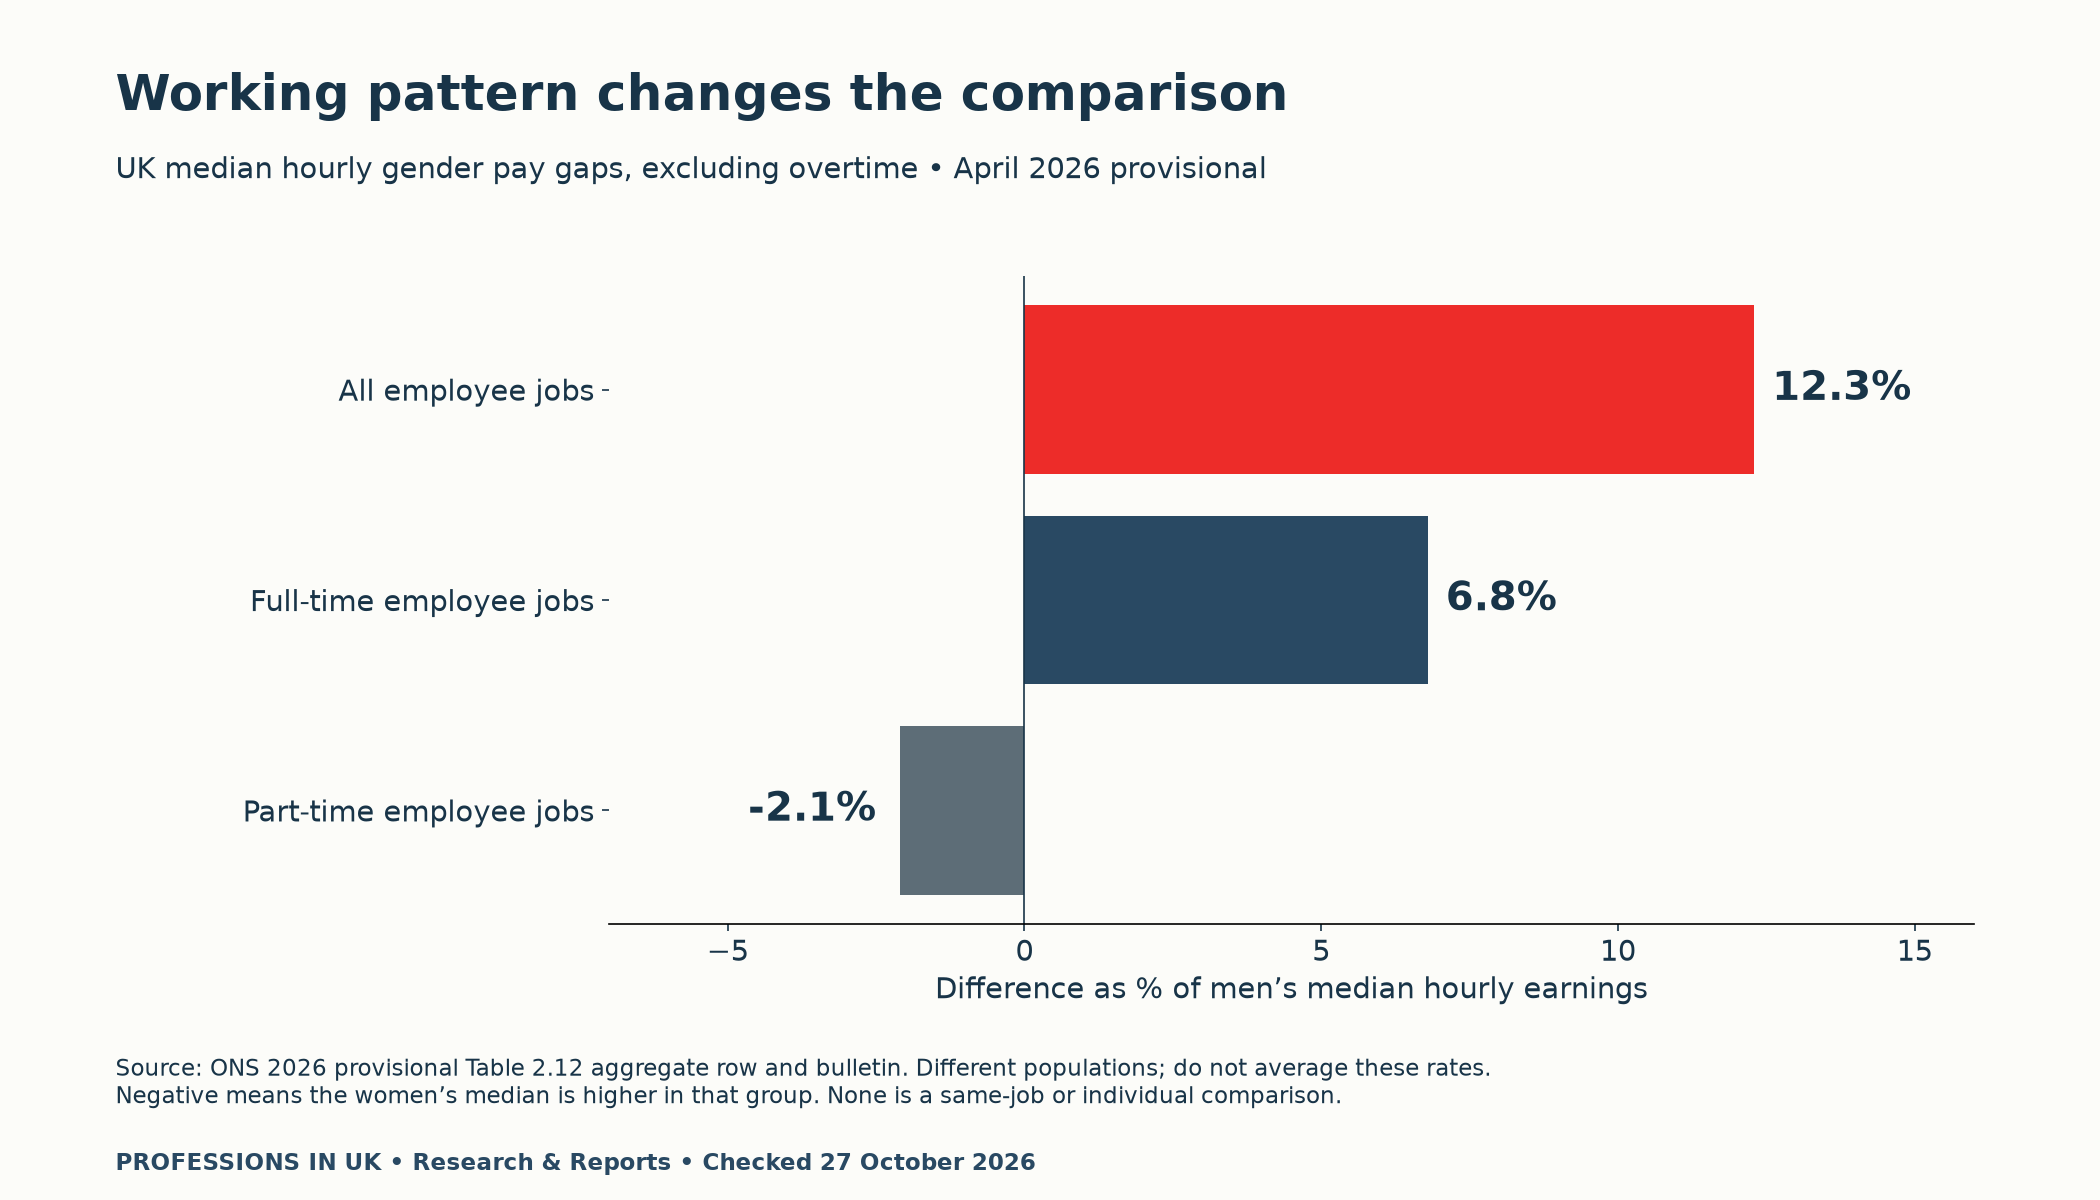
Start by writing down the comparison you actually need. For instance, a full-time professional role should not silently acquire an all-worker national statistic. Likewise, a median hourly measure should not become an annual salary estimate by multiplying it by your own hours.
ONS defines full-time as more than 30 paid hours a week, or 25 or more for teaching professions. The source covers employee jobs on adult rates whose pay was unaffected by absence. These details belong in your notes even when a chart headline cannot contain them all.
A five-field comparator check
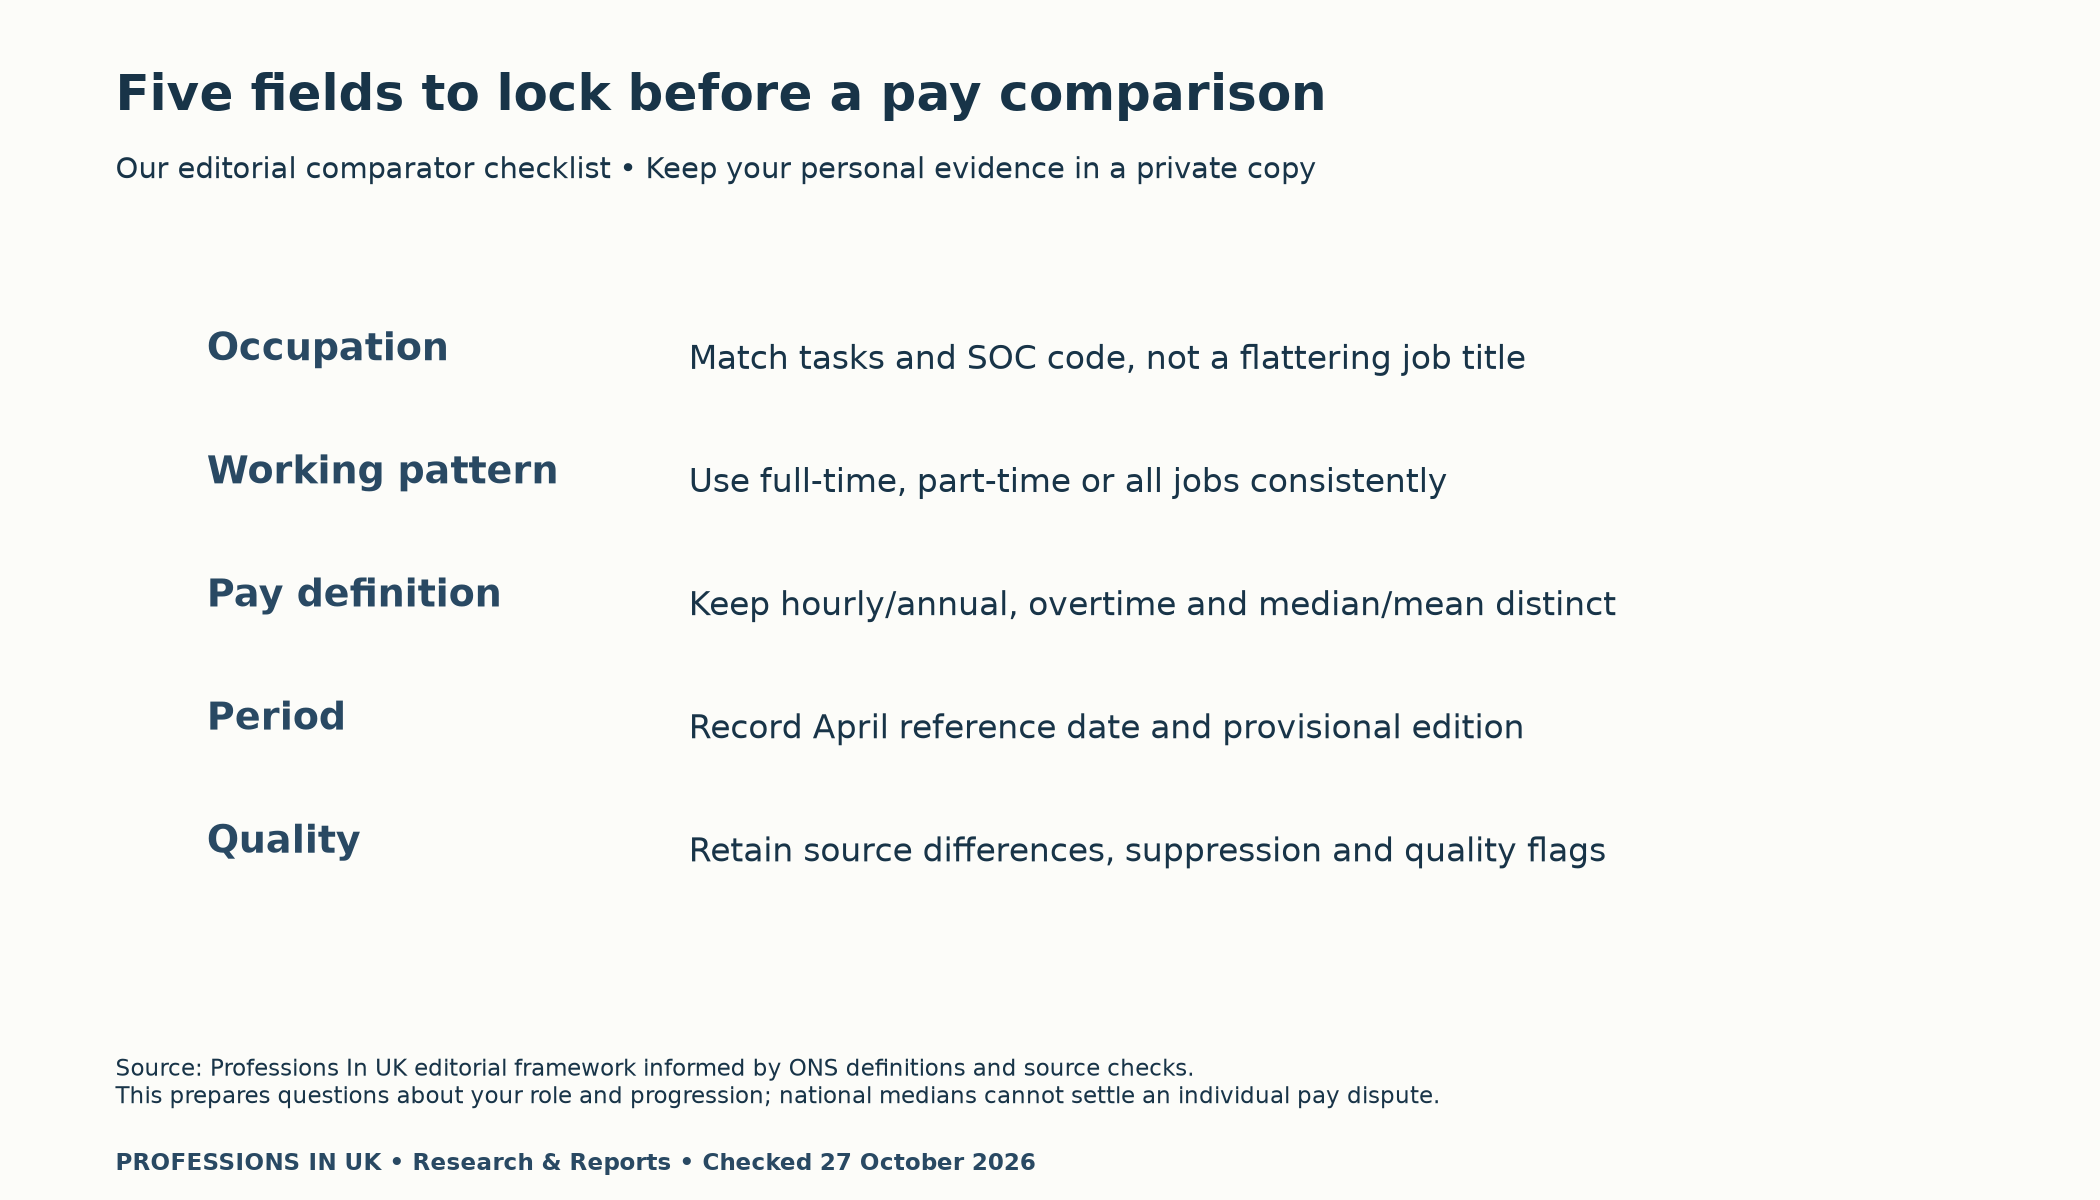
- Occupation: match the work and code, rather than choosing a title that sounds similar.
- Working pattern: record full-time, part-time or all jobs before selecting a figure.
- Pay measure: distinguish hourly from annual pay, median from mean and overtime from base earnings.
- Reference period: write “April 2026, provisional”, not simply “2026 salaries”.
- Quality: keep suppression, sampling notes and source conflicts attached to the value.
For newcomers, matching the tasks can be especially useful when job titles differ between countries or employers. Write a short description of what you do, then check the occupational definition. A code is a statistical grouping; it is not a qualification assessment or an employer’s promise.
Turn the comparison into a specific discussion

Prepare a one-page account of your role, responsibilities and documented results. Choose examples you can explain clearly. A national figure can provide context, while your own evidence supports a focused question about how the organisation assesses your work.
Personalized UK Career Consulting
Receive tailored career guidance designed just for you. Get actionable steps and expert support to boost your career in 1-3 days. Take control of your career now.
Get StartedFor example, ask: “Which salary band covers these responsibilities, and what evidence would support progression?” Another useful question is: “When will we review the additional work I now perform?” Record the answer, any agreed action and a review date.
Keep three questions separate: how your occupation compares, how your employer structures pay, and how your own responsibilities are assessed. Combining them into one accusation makes it harder to identify the evidence each question needs.
If your decision concerns a new offer, use our pay-rise and changing-jobs study to examine extra work costs separately. Our pay-versus-inflation report answers a different question about purchasing power. Neither replaces a matching occupational comparator.
Get the source audit and blank planner
Download the nine-occupation source audit (CSV) for both official values, codes, labels and quality notes. Open the blank pay-discussion comparator worksheet (CSV) to prepare your own questions. Keep personal pay and employment information in your private copy; this website does not collect it.
Method and limits
We retained the official Figure 5 CSV and the 2026 provisional workbook archive. We matched its nine major occupational codes to the chart’s source order. Next, we compared column C on the Full-Time sheet, retained its quality formatting and flagged unequal values.
The estimates are provisional, sample-based and unadjusted. Changes can reflect workforce composition as well as earnings. They are not interchangeable with mandatory employer disclosures and cannot establish an individual equal-pay claim. This article provides statistical interpretation and discussion preparation, not a legal assessment of an employer.
Our charts, audit and worksheet are reproducible editorial outputs. ONS data are attributed under the Open Government Licence where applicable. The conceptual illustrations were generated with AI and do not depict actual survey participants. Future revisions should retain the earlier source values and explain any resolution of the two discrepancies.


