





A UK low-hiring job market can feel difficult even when your employer is not announcing redundancies. Keeping existing staff and recruiting someone new are different decisions. A quiet redundancy picture therefore does not tell you how many suitable openings exist for your next move.
In her 10 November 2026 Bank of England speech, Clare Lombardelli describes a low-hire, low-fire market. The useful distinction for a jobseeker is between employment that remains in place and opportunities that actually become available. This article turns that distinction into a private search-planning method, without recommending that anyone resign or stay because of a national statistic.
How a UK low-hiring job market can hide behind stable jobs
An employment total is a stock: it describes how many people are in work under a defined measure. Hiring, exits and direct job changes are flows over time. Similar-looking totals can conceal very different patterns of movement. Your current employer’s retention decision is only one part of that picture.
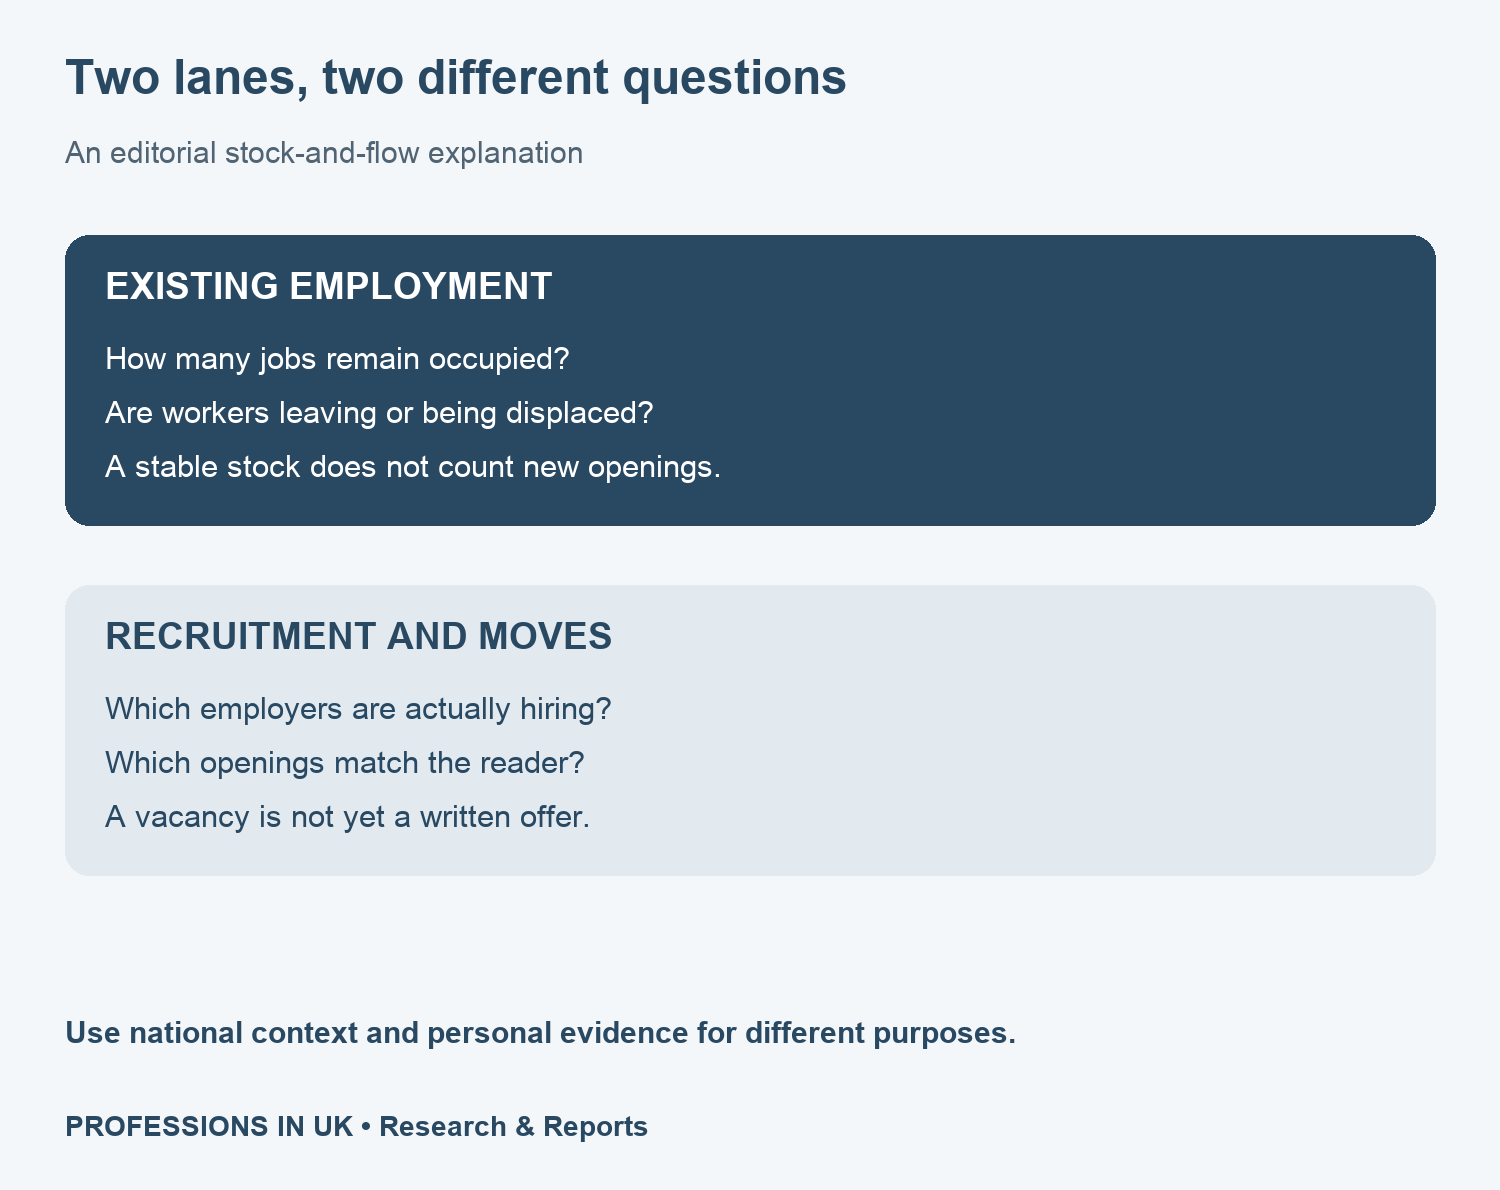
For a fictional example, imagine a team that keeps all its staff but stops replacing leavers elsewhere in the organisation. Someone already on that team may see little visible change. A candidate applying from outside could encounter fewer openings. This example illustrates the distinction; it is not evidence about a particular employer.
Annual movements and quarterly rates are different measures
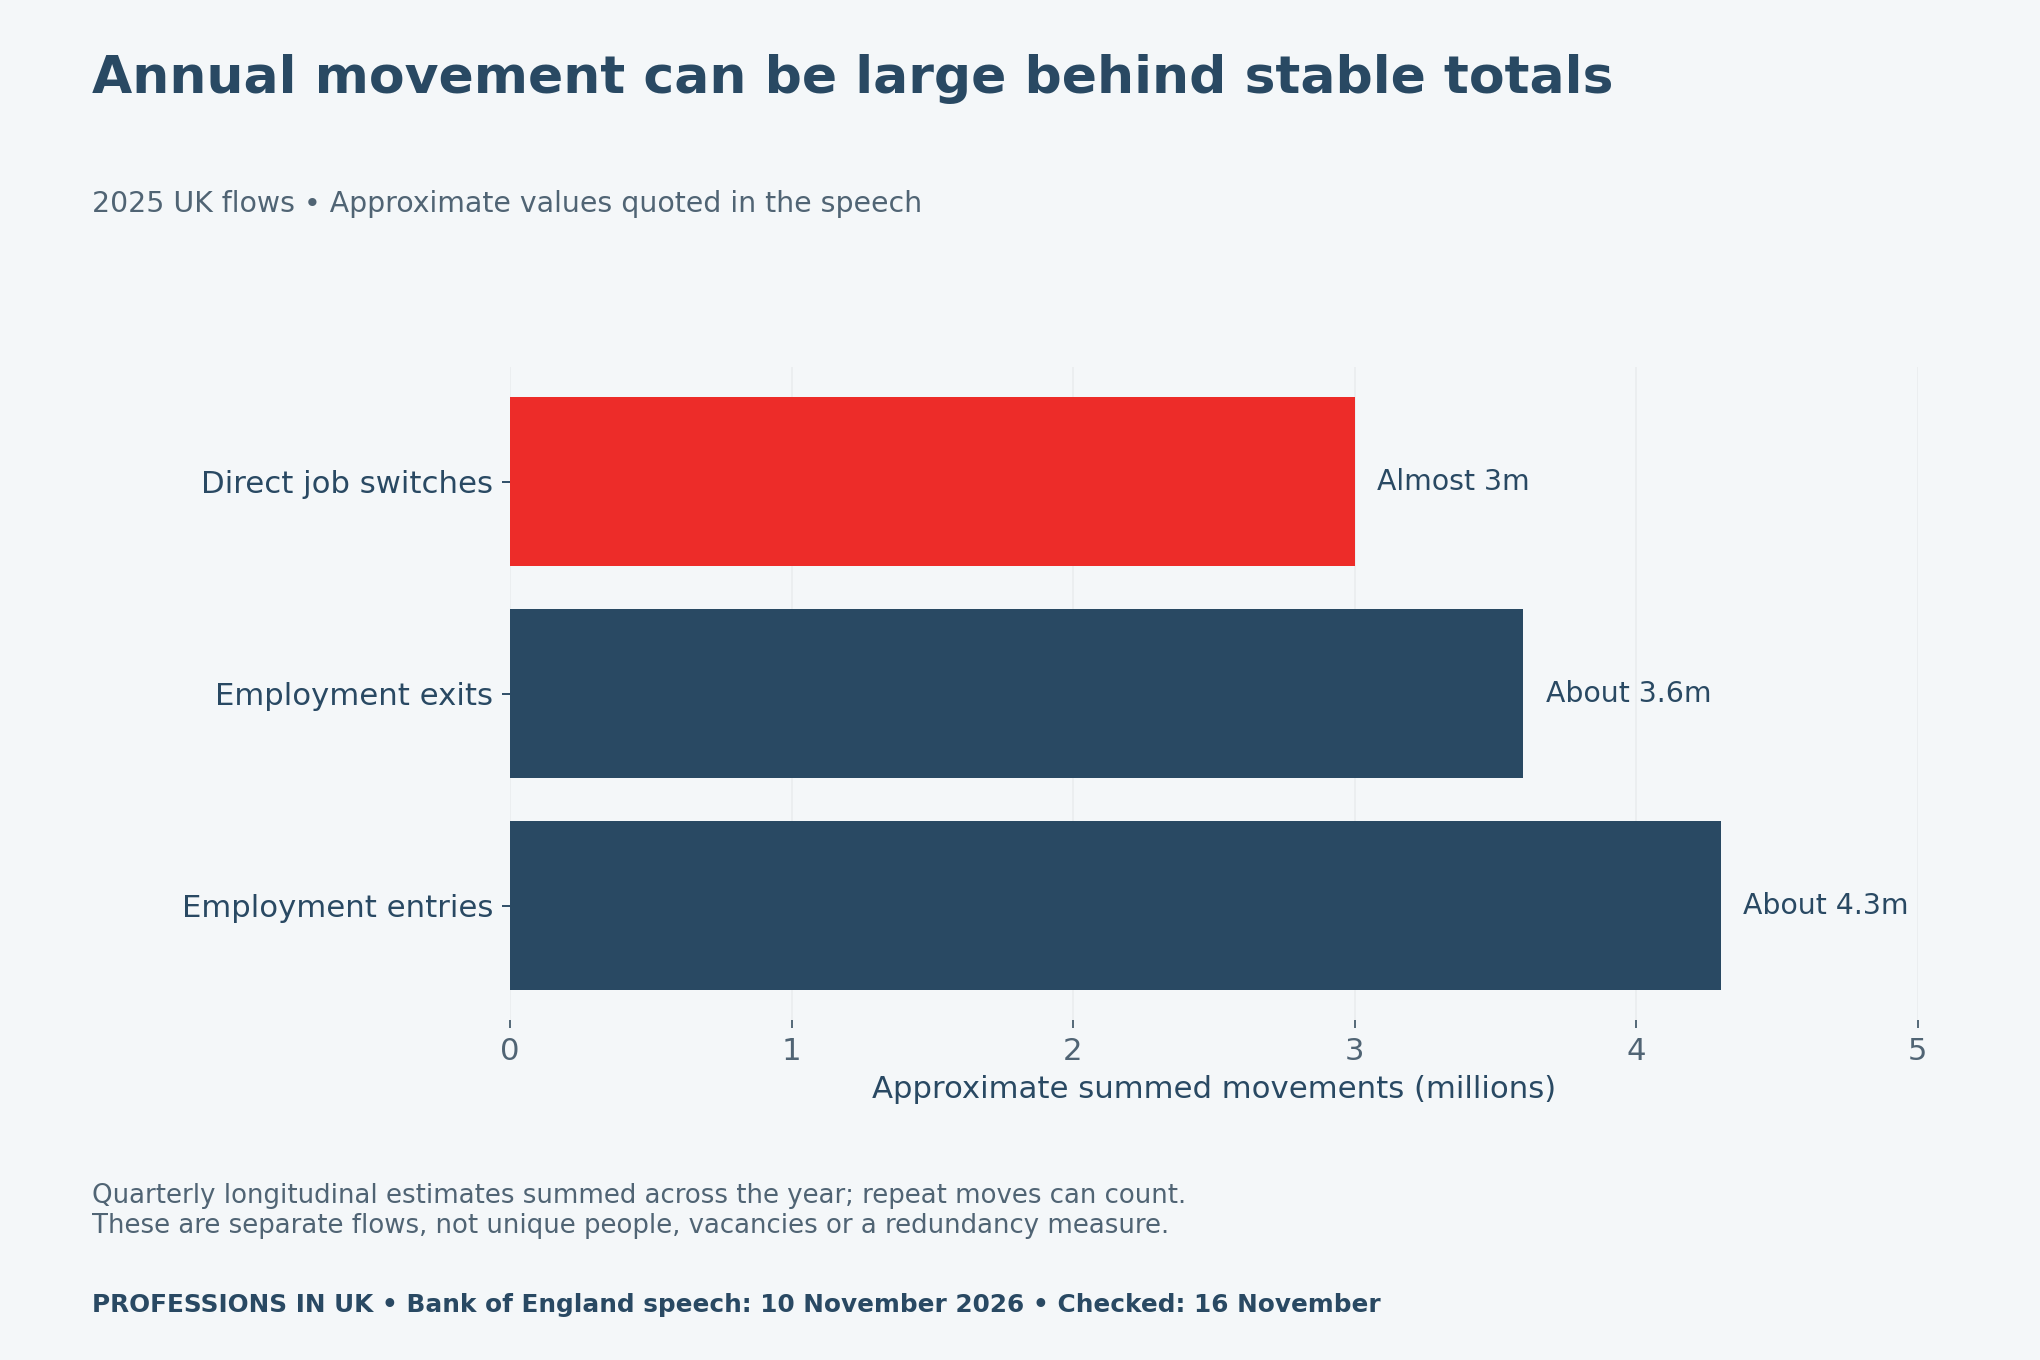
The speech’s almost-three-million job-switching figure relates to 2025. Its quarterly switching discussion describes more than 3% around thirty years earlier and a little above 2% over the past year. Chart 10 is smoothed with a four-quarter moving average. These statements use different time bases.
| Measure | Unit and period | Do not infer |
|---|---|---|
| Almost 3 million job switches | Approximate sum across 2025 quarters | Exactly 3 million different people |
| Around one in twelve employed | Annual comparison stated in the speech | A personal chance of securing a new job |
| A little above 2% switching | Recent quarterly rate; four-quarter smoothing in Chart 10 | An exact 2.00% rate or annual unique-person rate |
A person can move more than once in a year. A quarterly rate also uses its own denominator and observation structure. For these reasons, we do not convert the rounded speech figures into a precise annual probability. The measures provide context for mobility, not a forecast for an individual application.
Check opportunities in the occupation and region you can use
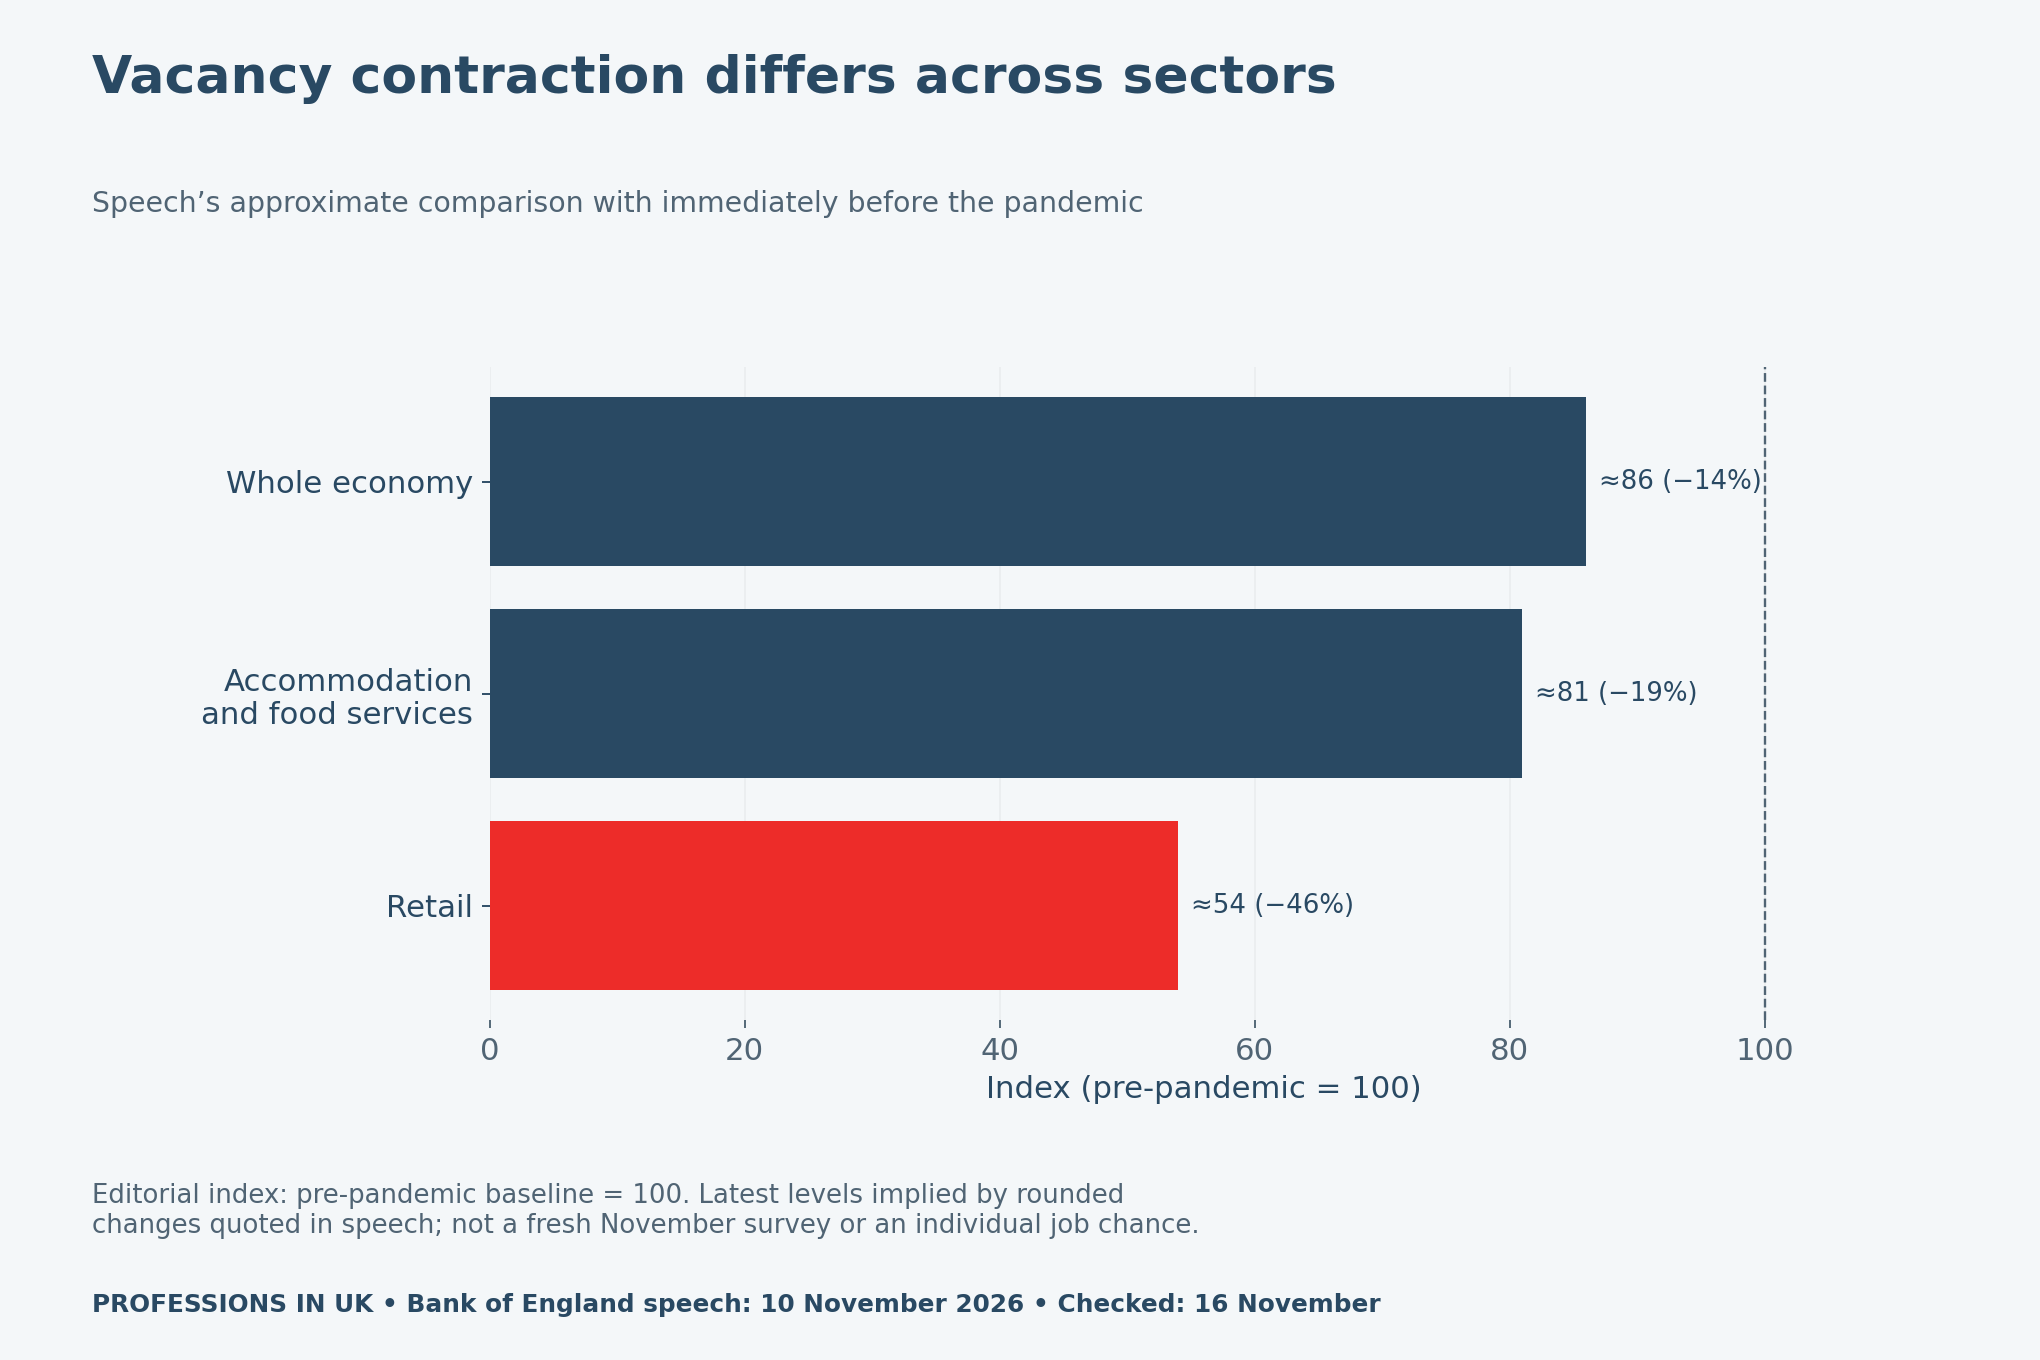
A national average may describe a different market from the one you can realistically enter. Begin with the occupation, region, hours and essential conditions you need. Record those boundaries before collecting listings. Otherwise, changing the definition halfway through can make a personal search appear to improve simply because more unrelated roles were included.
Decide what counts as one vacancy. The same role can appear on an employer’s website, a recruitment platform and an agency feed. Keep the original link and a stable vacancy identifier where possible. Mark duplicates rather than counting every appearance as an additional opportunity.
Build a confidential opportunity pipeline
The downloadable worksheet separates suitable unique vacancies, applications, interviews, written offers and accepted starts. Those stages answer different questions. A large number of saved adverts is not evidence of completed applications. An interview invitation is not a job offer, and an offer is not an agreed start.
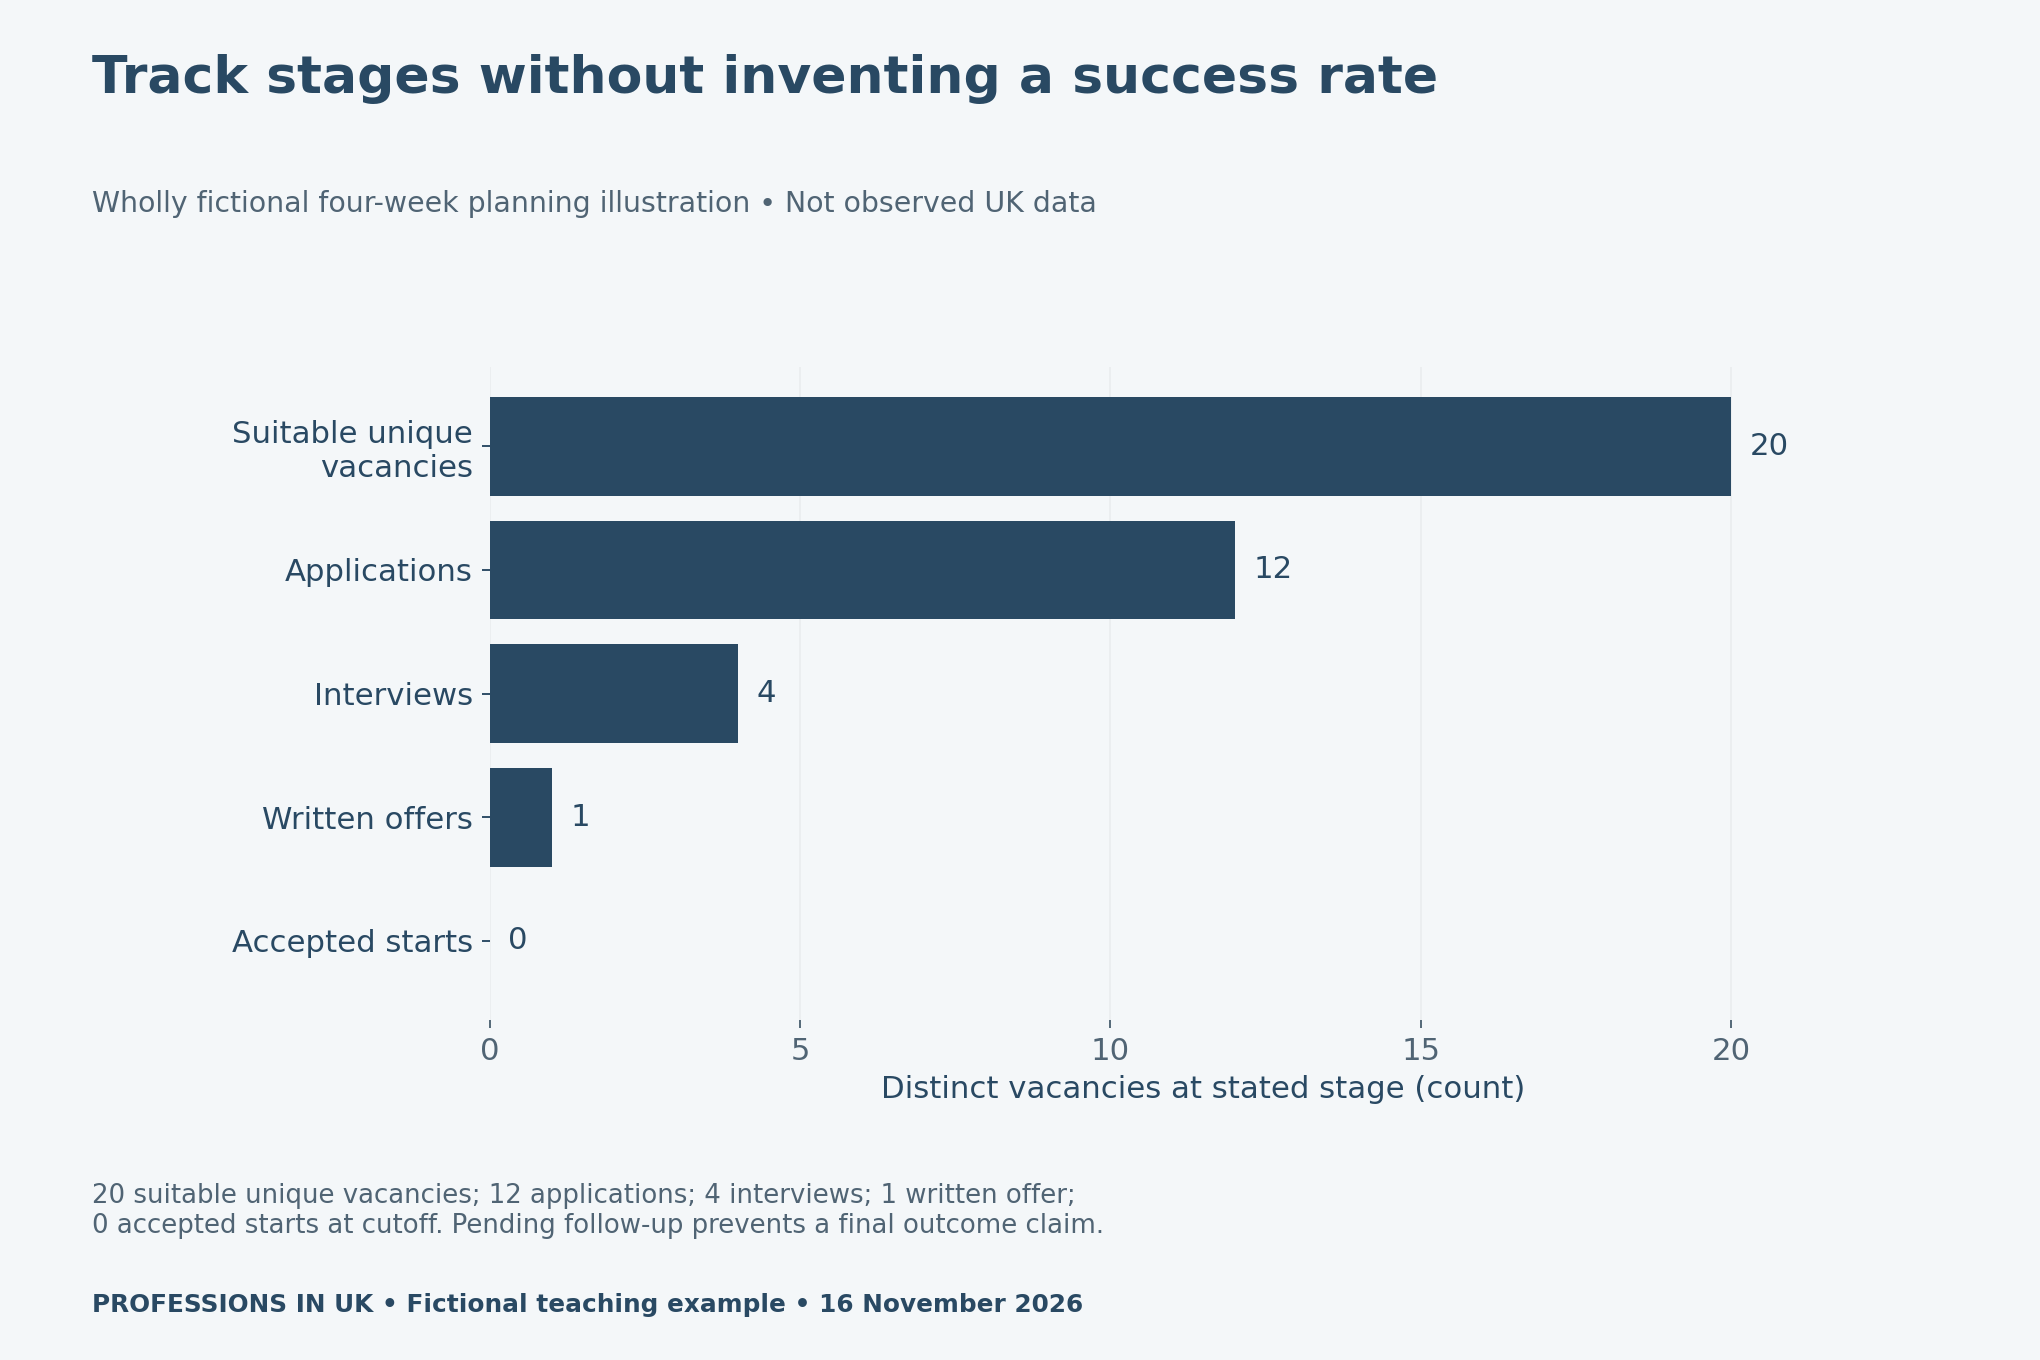
Use dates so you can distinguish an unanswered application from a closed outcome. If an employer has not responded by your review date, label the status pending. Treating every pending decision as a rejection would overstate what you know. Equally, counting an informal positive conversation as a written offer would overstate progress.
For example, the fictional pipeline contains one written offer and no accepted start. That does not establish that the remaining applications failed. Some may still be in progress; the offer may need clarification. Review the actual status before drawing a conclusion about the search.
Use a four-week audit as a planning exercise
A small personal audit can help organise effort if its scope is clear. Choose one occupation, one region and a four-week collection window. Set the sources, collection frequency, suitability checks and duplicate rule in advance. The blank protocol records those decisions without claiming that four weeks is a validated sample of the national market.
| Record | Why it matters |
|---|---|
| Original vacancy link and first-seen date | Distinguishes a new opening from a repost |
| Occupation, region and essential conditions | Keeps the suitability definition stable |
| Stage and action date | Separates activity from progress |
| Pending follow-up and cutoff date | Shows which outcomes remain unknown |
| Reason for exclusion or duplicate link | Makes the counts reproducible |
At the review point, report counts and unresolved follow-up. A narrow audit cannot estimate the success probability for all UK workers. It may help you identify a practical question: are there few suitable openings, are applications not reaching interview, or do offers leave important terms unclear? Each issue suggests a different next conversation.
Keep career choices separate from the macro headline
A subdued national hiring picture does not establish the security of your current job. Nor does it prove that a particular move is a mistake. Consider actual written terms, practical constraints and your own priorities. Avoid treating a general chart as a decision rule for leaving employment.
Our changing-jobs pay comparison considers the financial side of an offer. The UK IT shortage-title analysis addresses role matching. This report focuses on a separate question: how to tell national stability from accessible opportunities and track what your own search actually shows.
Personalized UK Career Consulting
Receive tailored career guidance designed just for you. Get actionable steps and expert support to boost your career in 1-3 days. Take control of your career now.
Get StartedMethod, source limits and downloads
The charts use rounded figures quoted in the Bank speech, not unpublished underlying microdata. For vacancy levels we calculate 100 minus each quoted percentage decline. We do not draw a precise historical switching-rate line from approximate prose. The speech cautions about Labour Force Survey quality; its footnote explains that annual flows sum quarterly longitudinal data and can include repeat moves.
The third chart is wholly fictional and the audit remains proposed. None of the assets establishes causation, worker reluctance, individual security or a national application success rate. Keep publication dates, reference periods and planning examples separate when citing this work.
- Source measures, periods and limitations (CSV)
- Blank confidential search-pipeline worksheet (CSV)
- Blank four-week audit protocol (CSV)
- Fictional example and measure dictionary (CSV)
Suggested citation: Professions In UK, “UK Low-Hiring Job Market: Why Stable Jobs Hide Weak Openings”, 16 November 2026. Source: Clare Lombardelli, Bank of England speech, 10 November 2026; separate editorial calculations and fictional teaching example.


