





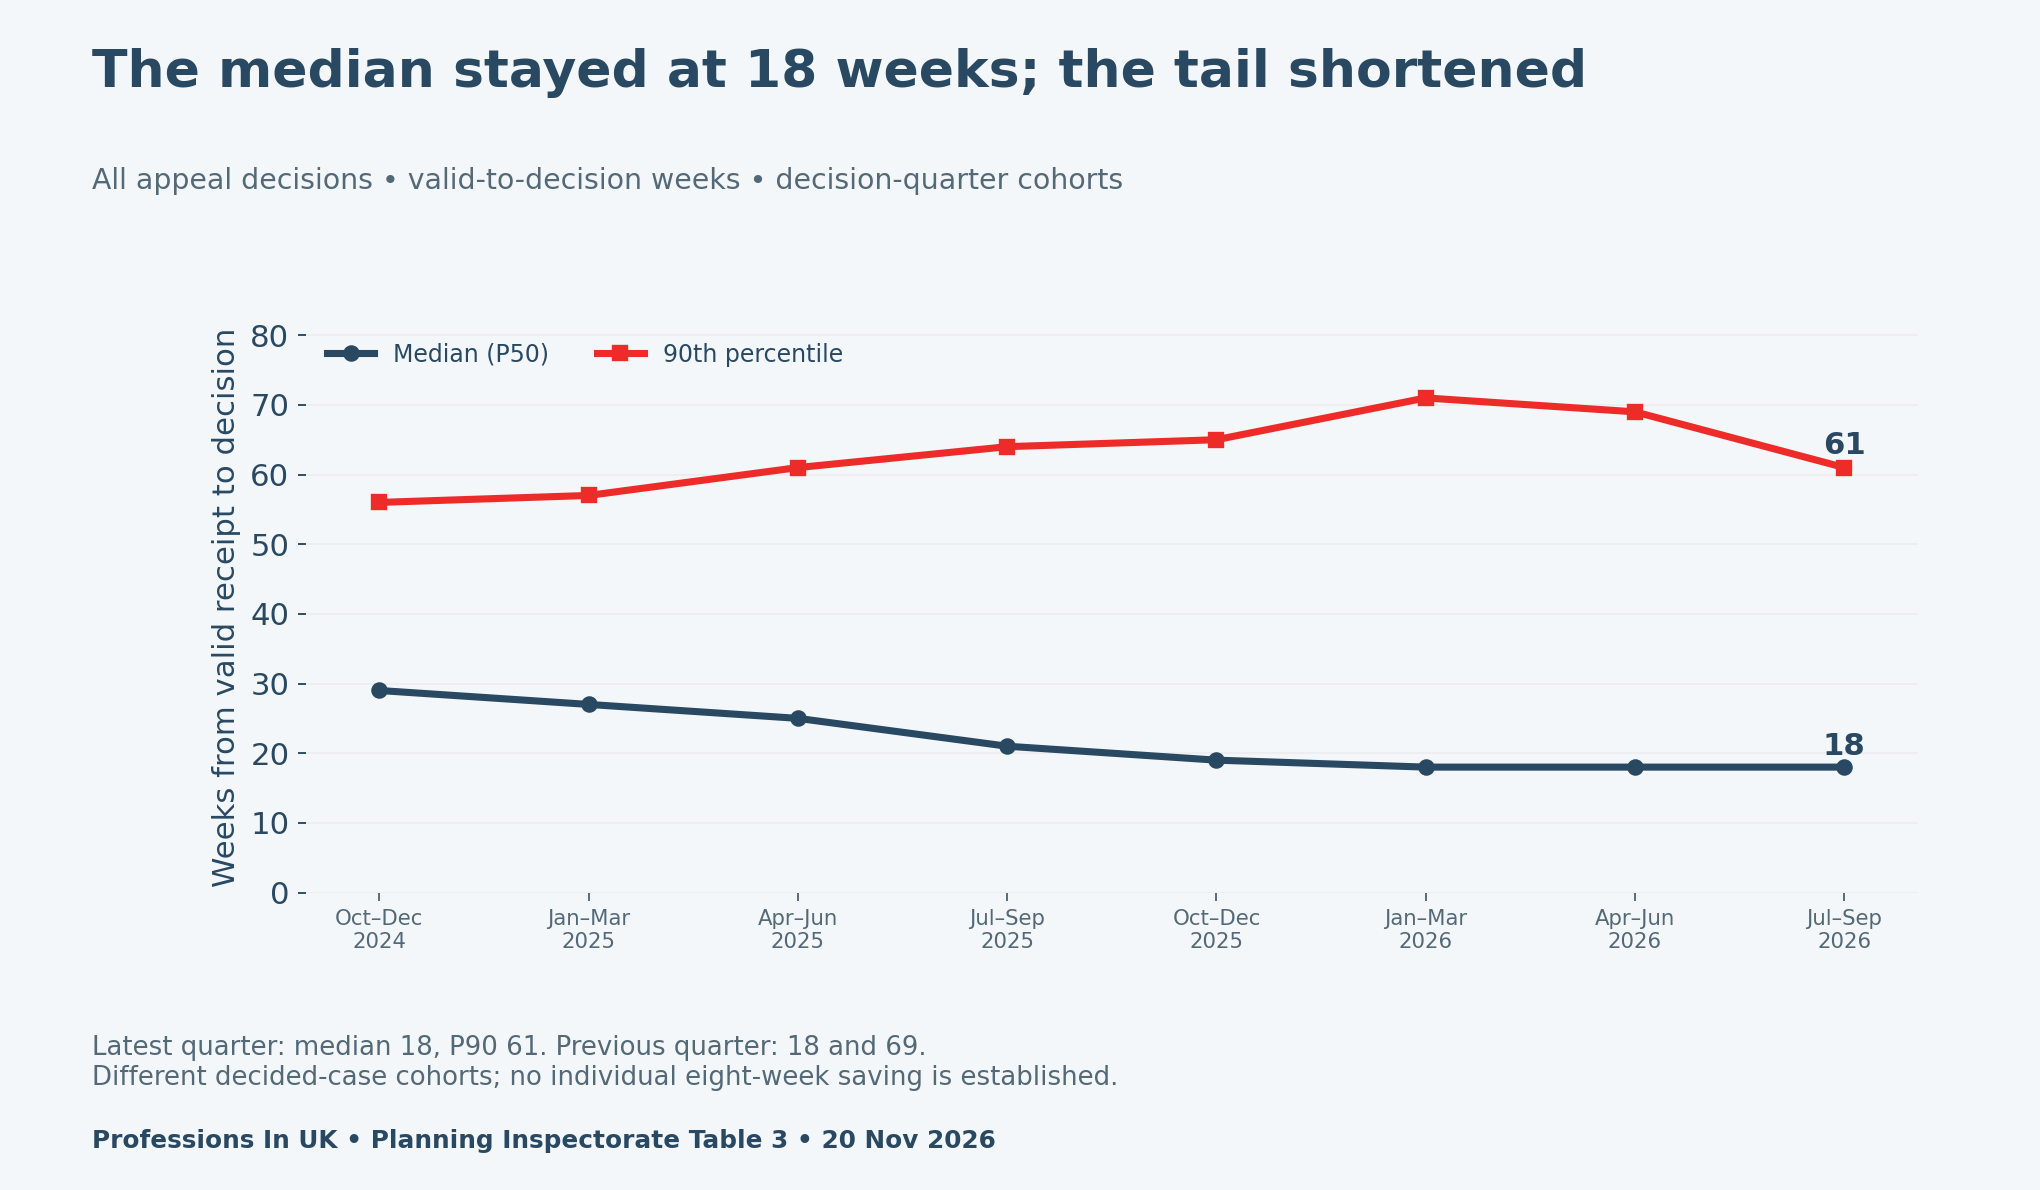
A planning analyst portfolio UK employers can assess should explain more than a headline average. The latest all-appeal table leaves the median at 18 weeks while the 90th percentile falls from 69 to 61 weeks. A useful work sample reproduces both measures, states the clock and stops short of claiming a cause.
Planning analyst portfolio UK: start with the source table
The Planning Inspectorate release of 19 November 2026 provides quarterly all-appeal percentiles in Table 3. For July–September 2026, it shows an 18-week median and a 61-week 90th percentile. The preceding quarter shows 18 and 69. Our calculation therefore reduces the median-to-tail gap from 51 to 43 weeks.
This exercise uses that all-appeal table consistently. Some procedure-specific narrative and tabular values differ within the release, so we do not silently combine them into a new series. Keeping one named table makes the portfolio calculation reproducible and the scope easy to review.
Define the cohort before plotting it
These quarters group cases by when a decision was made. They do not group applications by when someone first submitted them. That distinction matters because a case decided in one quarter may have begun much earlier. Write the cohort definition beside the chart, not only in a hidden spreadsheet note.
Next, define the clock. Here the interval runs from valid receipt to decision. It is not automatically the entire interval from an applicant’s initial submission. A reviewer should be able to identify the start event, end event and unit without guessing from an axis marked only “time”.
Explain why an unchanged median can hide change
The median describes the middle of a distribution. It can stay at the same displayed value while the upper part changes substantially. Reporting only the median would miss the movement in the 90th percentile. Reporting only the upper percentile would omit the stable midpoint.
A concise management explanation should hold both facts together. “The median was unchanged at eighteen weeks, while P90 fell to sixty-one weeks” is more informative than “appeals became eight weeks faster”. The latter gives every case a saving that the aggregate table cannot establish.
Calculate the gap, then name its limit
Subtract the median from P90 within each quarter. For April–June, 69 minus 18 equals 51 weeks. For July–September, 61 minus 18 equals 43 weeks. Subtracting those gaps gives an eight-week narrowing. Each operation is simple, but its interpretation still depends on the same cohort and clock.
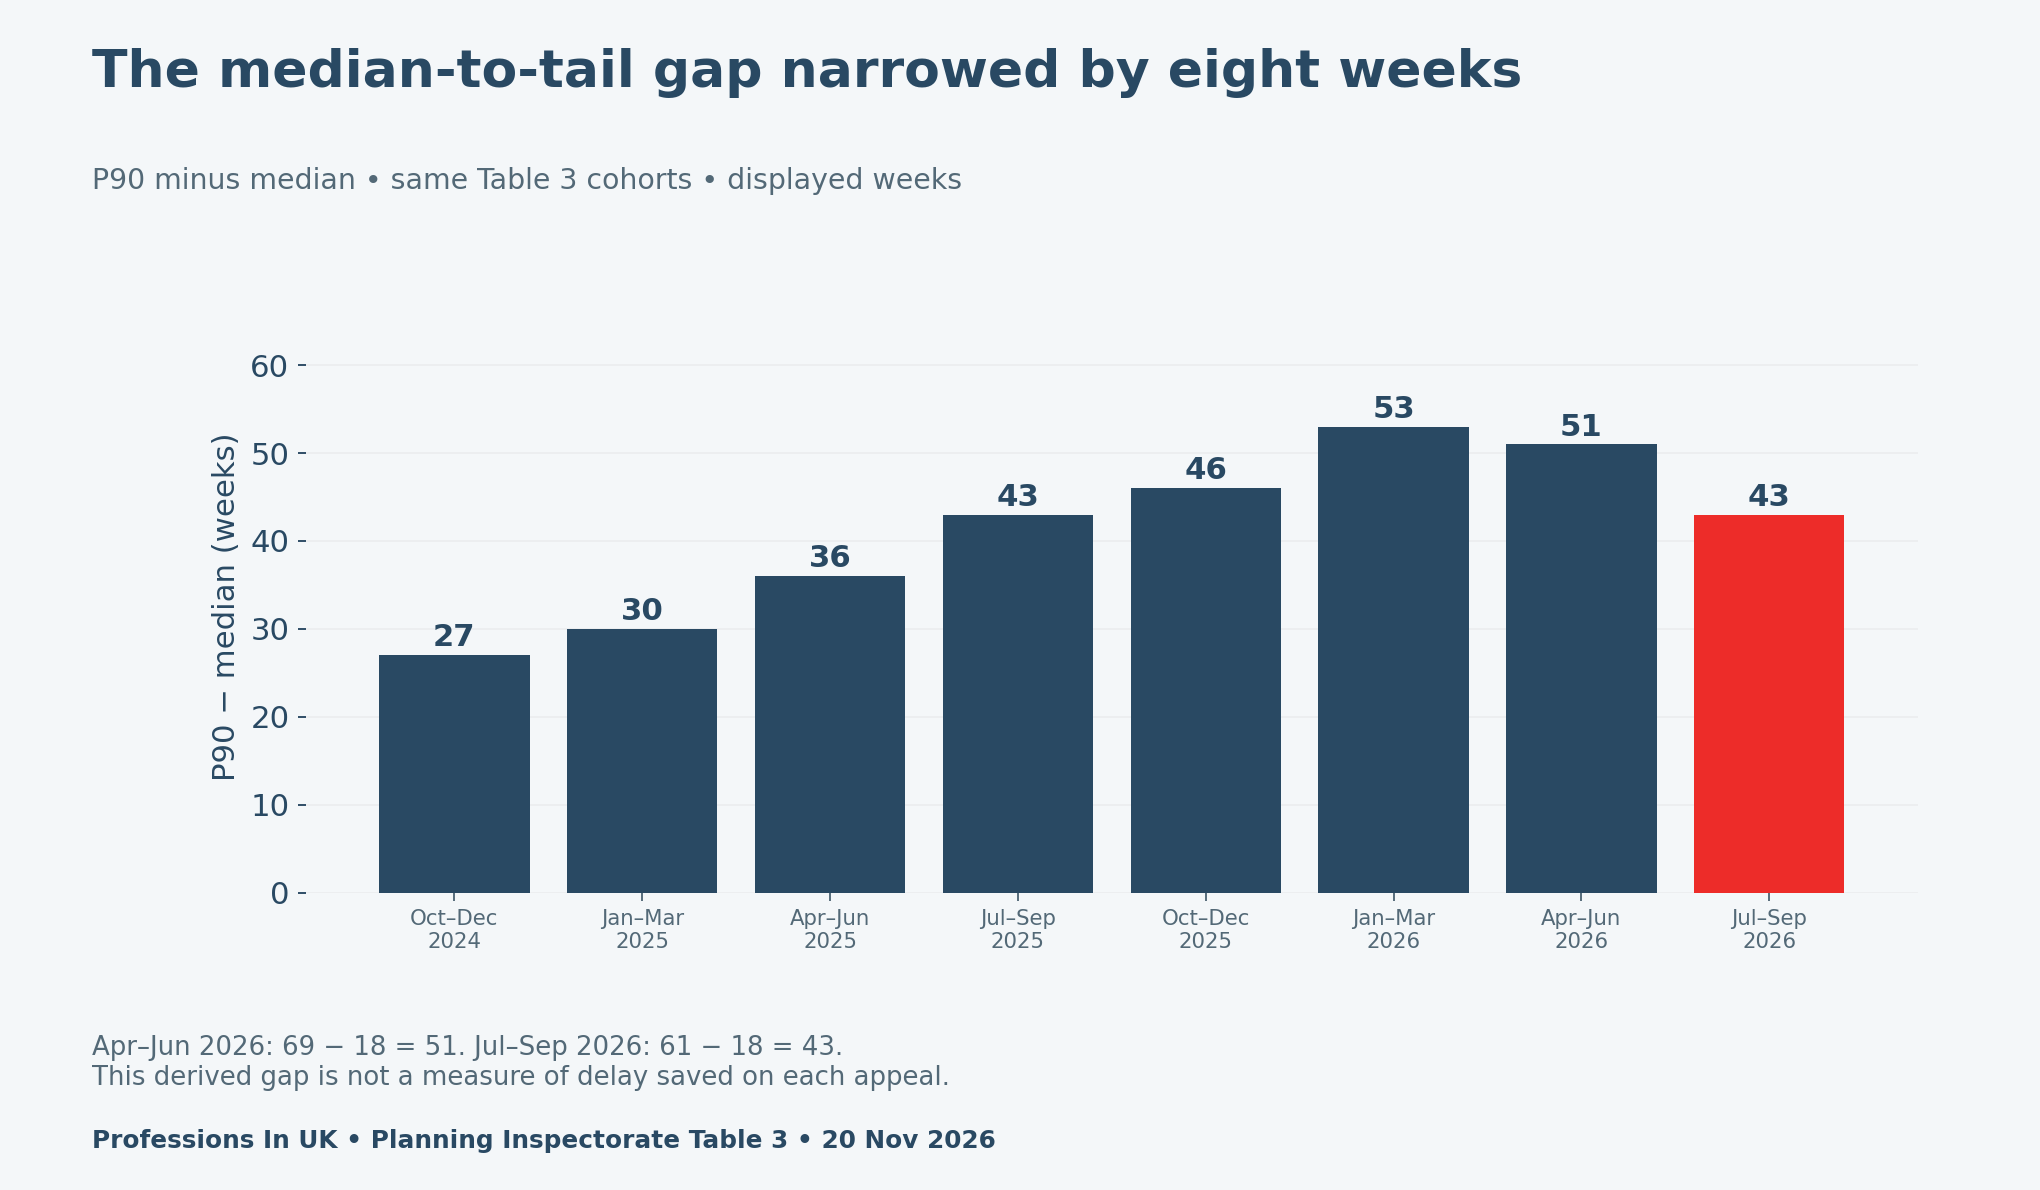
Do not call P90 the maximum. It is a percentile boundary, not the longest case in the data. Similarly, an eight-week movement in P90 does not tell you that the remaining open cases will finish eight weeks sooner. They are not the same group as the cases already decided.
Show a reviewer the measurement boundaries
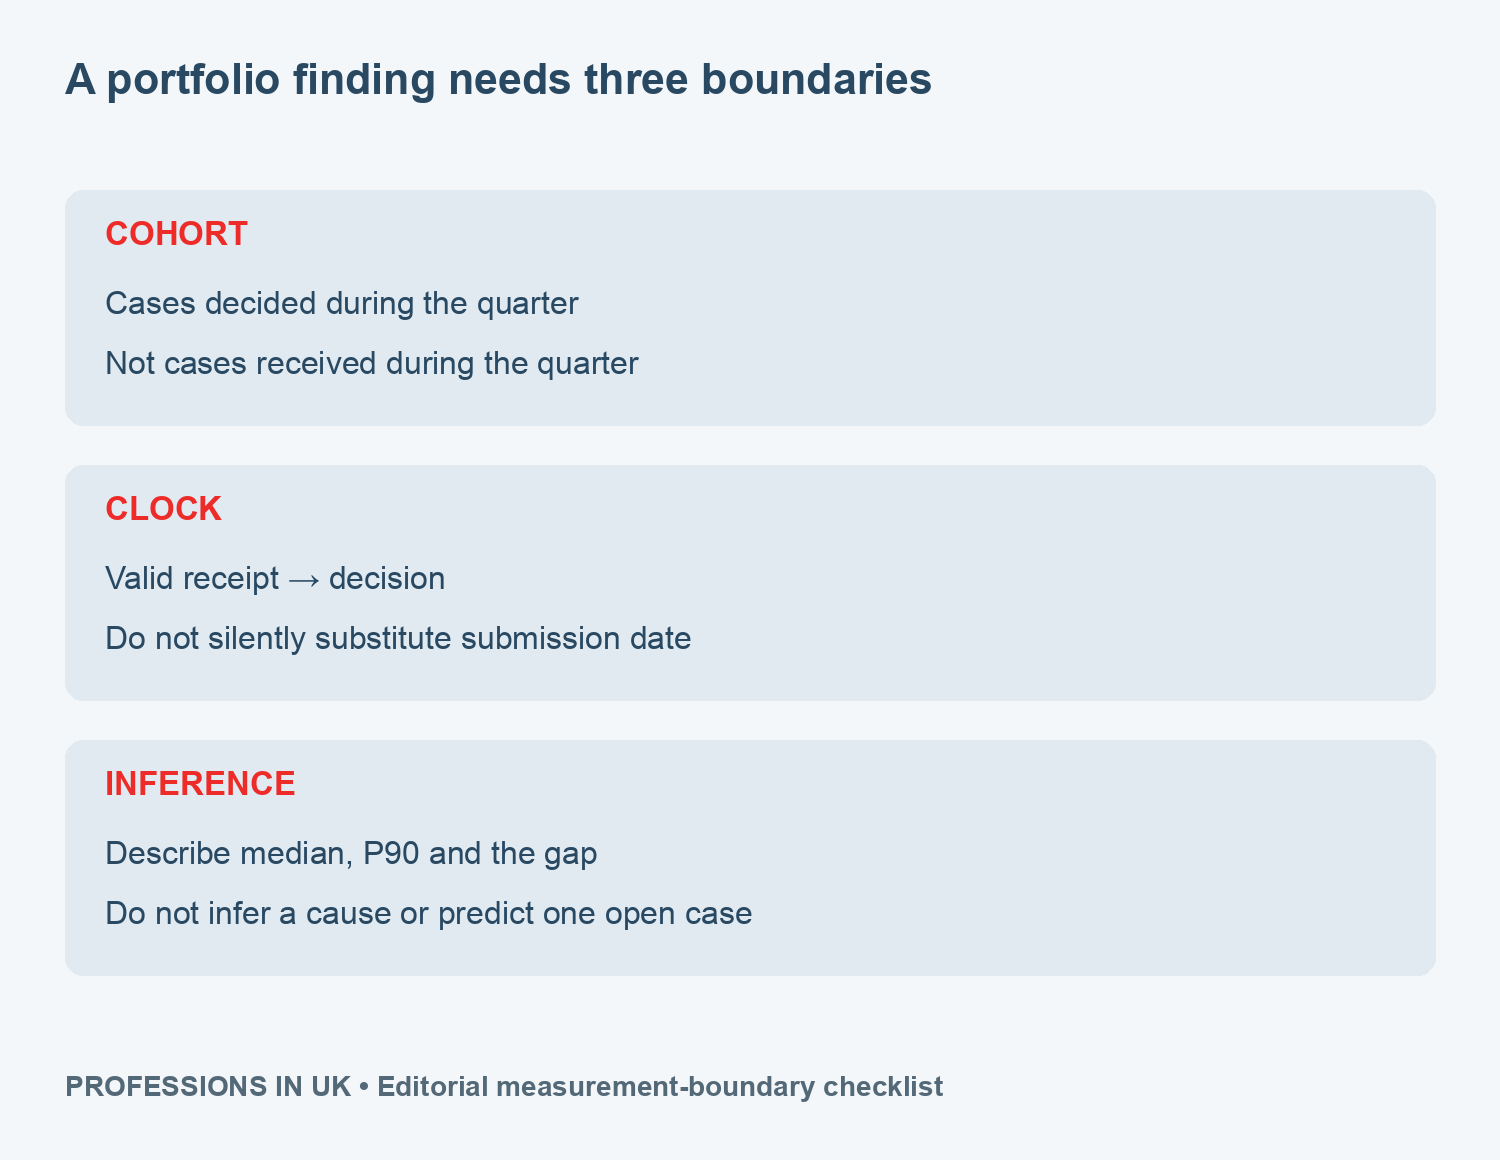
Keep a small measure dictionary with the source version. Add a calculation column for the gap and retain the displayed input values. If you later update the work sample, preserve the earlier version rather than mixing revised and unrevised points without explanation.
A good review question is “What additional evidence would help explain the change?” Possible investigations include procedure mix, case characteristics and revisions. Those are questions, not conclusions. The two percentile lines alone cannot prove a staffing effect, operational intervention or change in case difficulty.
A fictional management note for the portfolio
Example note, written as an exercise: Table 3 reports an unchanged median of 18 weeks for appeals decided in July–September 2026, alongside a P90 of 61 weeks compared with 69 in April–June. The derived median-to-tail gap narrows from 51 to 43 weeks. This indicates a shorter upper-percentile interval among the latest decided-case cohort, while the displayed midpoint remains stable. It does not establish an eight-week saving for each case or explain why the distribution changed. Before recommending an operational response, I would check source revisions, case mix and the consistency of procedure definitions. Open appeals require separate analysis because this table describes completed decisions. I have retained the input table, a measure dictionary and the subtraction used for each quarter. The next review should agree which additional data are available and whether they can support a more specific explanation without confusing decided cases with incoming or unresolved work. Any later update should identify its source version.
The note demonstrates interpretation and restraint. It is fictional portfolio copy, not a statement by the Inspectorate. Adapt its structure to your own evidence rather than presenting it as workplace experience you have not had.
Package the work so another person can reproduce it
Submit the source-value file, dictionary, chart exports and a short review checklist together. Name the source table and research date in the note. Include the formula, explain rounding and state what you deliberately did not infer. That gives a reviewer something concrete to test.
For another example of careful milestone interpretation, see our prison employment support handoff analysis. It addresses a different service, but the same principle applies: define the measure before deciding what a headline can support.
Personalized UK Career Consulting
Receive tailored career guidance designed just for you. Get actionable steps and expert support to boost your career in 1-3 days. Take control of your career now.
Get StartedDownload the portfolio data and checks
- Quarterly Table 3 inputs and calculated gaps (CSV)
- Cohort, clock and percentile dictionary (CSV)
- Blank portfolio analysis review checklist (CSV)
Methodology and limitations
We checked the release on 20 November 2026, transcribed the eight quarterly all-appeal rows and recalculated P90 minus median. Inputs are displayed whole weeks, so the derived gaps retain that precision. The release identifies these as Official Statistics in Development and excludes Rights of Way from the timeliness measure.
This planning analyst portfolio UK exercise provides descriptive analysis, not legal planning advice, a performance-causality finding or a prediction for a live case. No individual case records or statistical significance tests were added. Review the source’s current notes before extending the comparison to another period or procedure.


