





A supply chain analyst portfolio should make your reasoning inspectable, whether you are applying in the UK or building a learning sample. Show the inputs, calculate the operational gap and explain which assumption changes the answer. A neat dashboard is less useful when its units, missing values or decision boundaries are hidden.
This guide turns a current business-survey topic into a safe work sample. It includes five charts, a scenario-map infographic and four free CSV tools. All eight supplier records and disruption scenarios are fictional. We tested the calculations described below; no employer system, supplier record or hiring outcome was assessed. Research checked on 12 November 2026.
Supply chain analyst portfolio: start with the right question
The ONS release of 5 November reports October concerns about supply-chain impacts over the next twelve months. Its six selected percentages appear below. They refer to businesses with at least ten employees that had not permanently stopped trading, weighted by count. Concerns can overlap; they are not incident probabilities.
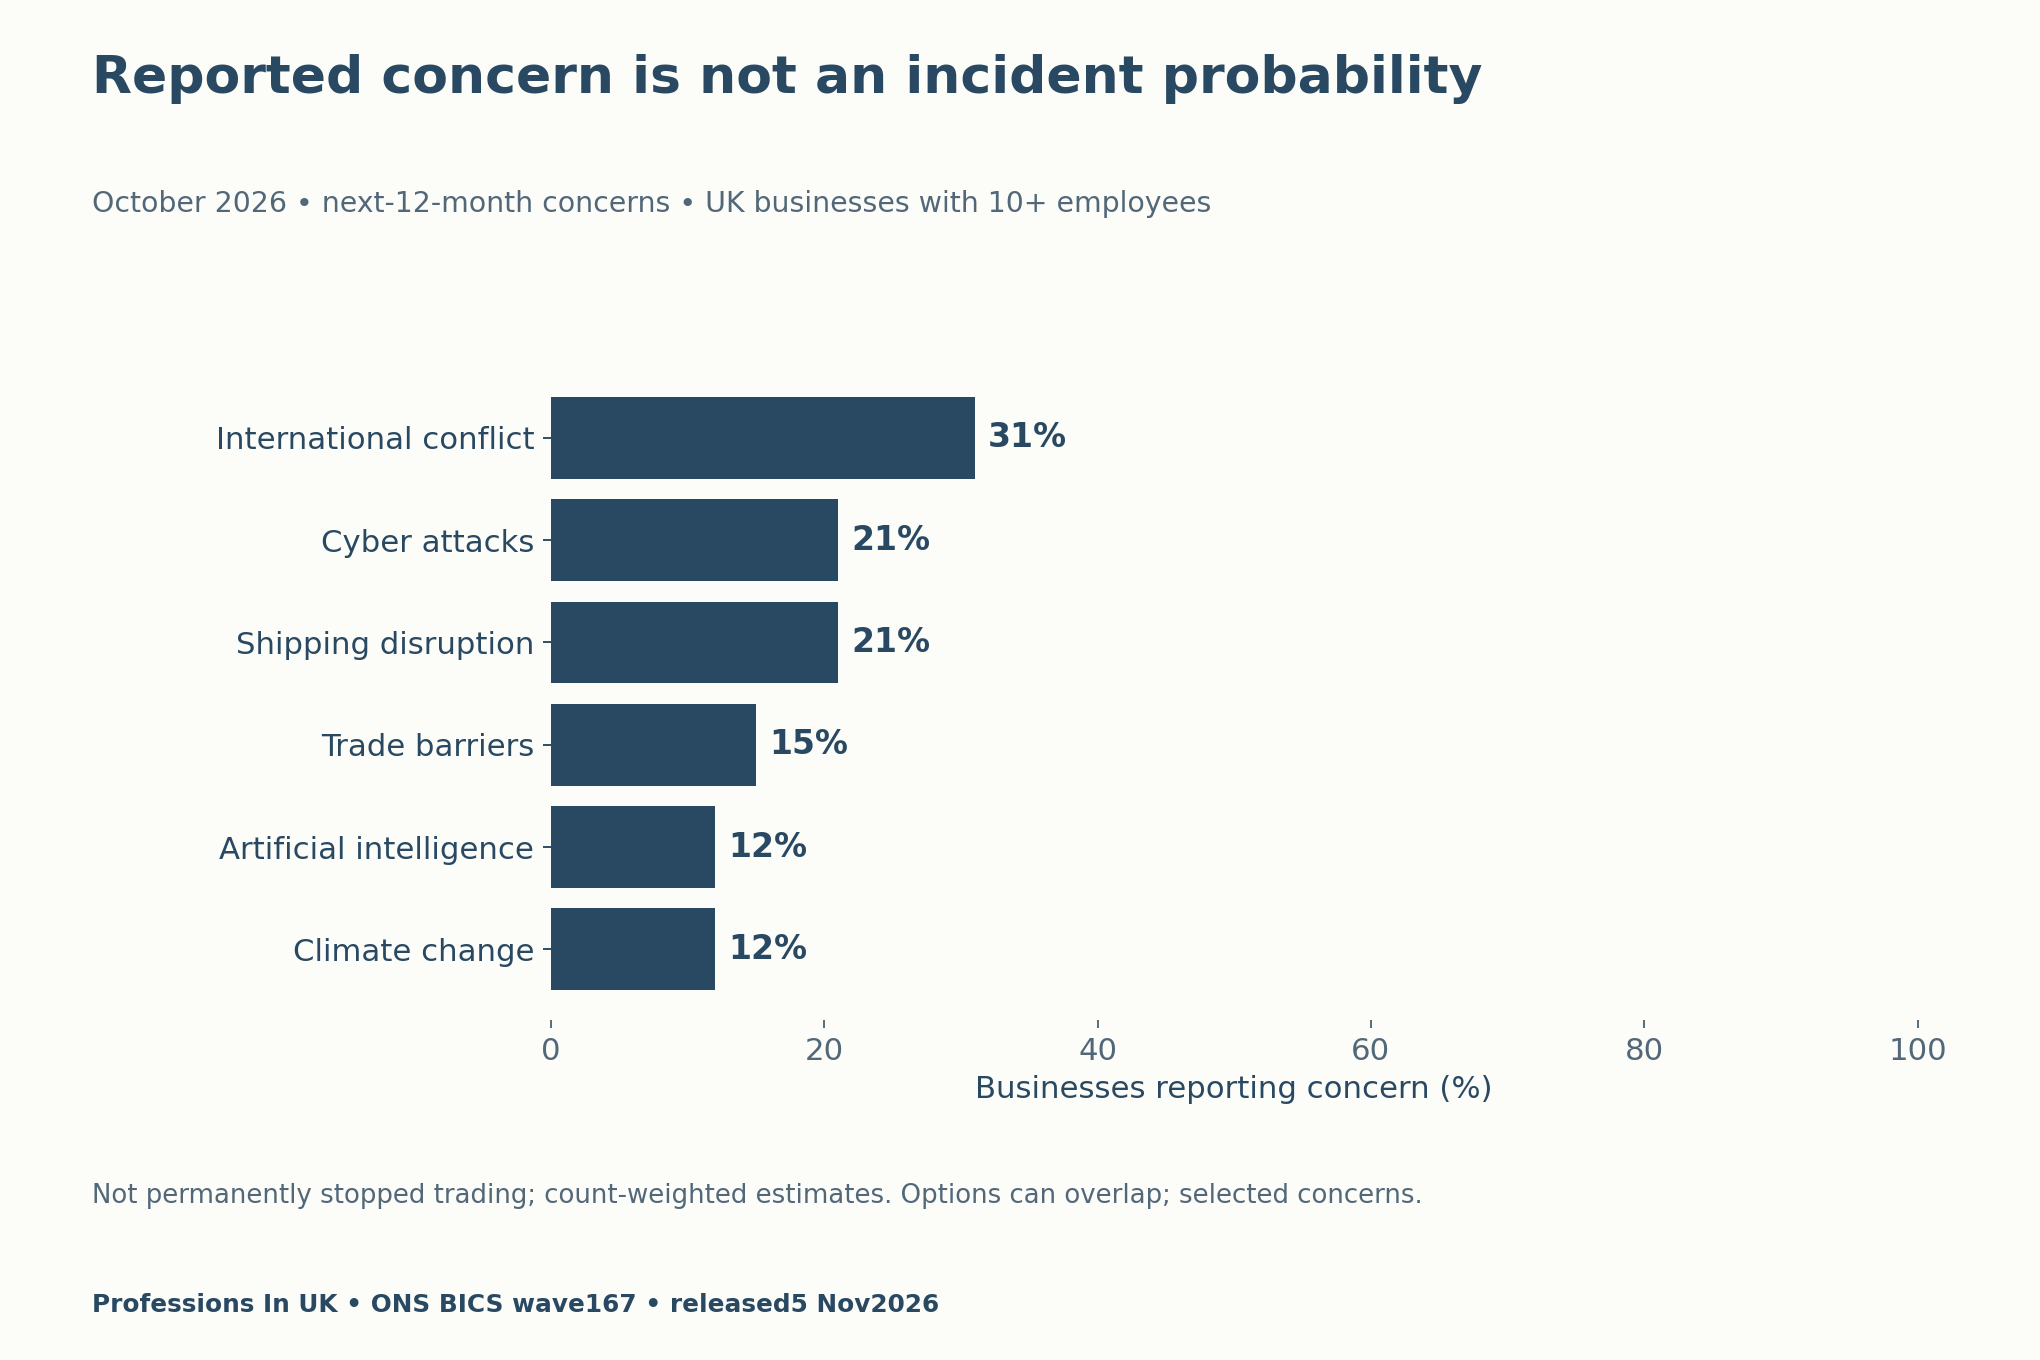
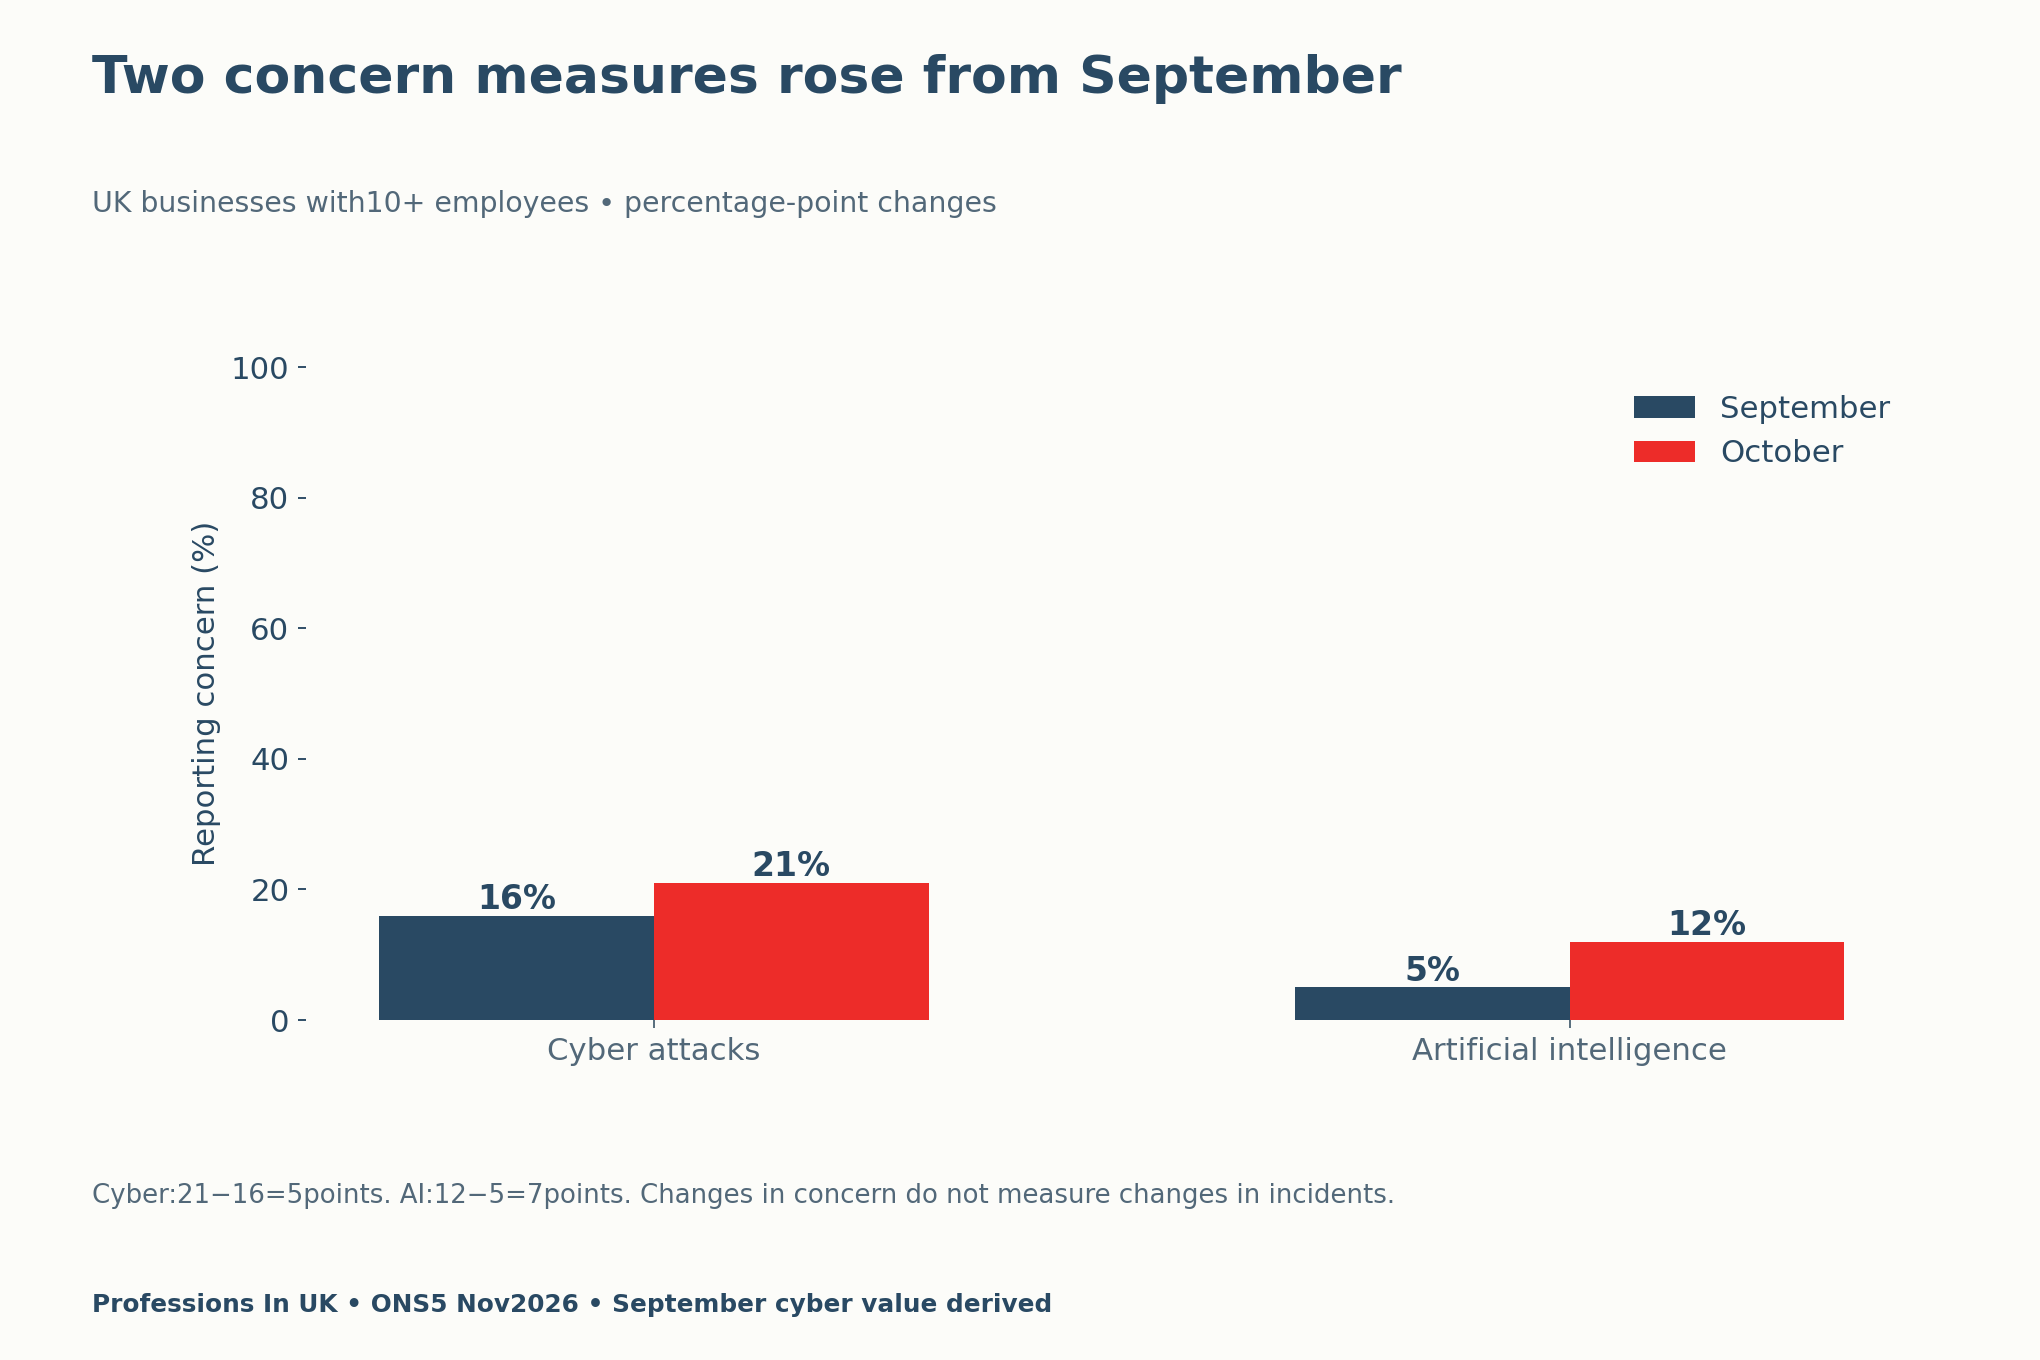
Wave 167 fieldwork ran from 19 October to 1 November. Its overall 9,628 responses from 38,542 sampled businesses produced a reported 25.0% response rate; those counts are not the ten-plus-employees question base. This voluntary survey produces official statistics in development. It excludes the public sector and some industries, so it does not describe every organisation.
Separate the news hook from your own model
Use the survey to motivate a practical question: what could happen if routine replenishment stops for a stated number of days? Do not multiply a concern percentage by a loss estimate and call the result expected loss. That would silently treat a respondent’s concern as a measured event probability.
Nor does the survey establish growing demand for analysts or a premium for a certificate. Your portfolio can demonstrate a calculation and a clear explanation. It cannot prove that an employer will interview you, or that the model predicts a real supplier’s performance.
Define a small fictional supplier dataset
Our eight invented records use demand in units per day, usable stock in units and alternate capacity in units per day. A normal lead-time field gives context only; it is not applied to the formula. Each supplier label A–H is fictional and unrelated to an actual business.
| Supplier | Daily demand | Initial stock | Alternate daily capacity |
|---|---|---|---|
| A | 100 | 300 | 40 |
| B | 80 | 640 | 0 |
| C | 50 | 100 | 10 |
| D | 200 | 1000 | 80 |
| E | 120 | 240 | 60 |
| F | 40 | 400 | 0 |
| G | 0 | 150 | 0 |
| H | 30 | Missing | 0 |
A workable model first declares what stays fixed. We hold demand constant, allow no normal replenishment during a disruption and treat all initial stock as usable. The alternate case assumes its stated capacity starts on day one and arrives reliably. We do not model ordering delays, minimum quantities, costs, product substitutions or capacity shared between suppliers.
These simplifications are choices to inspect, not facts to hide. If an alternate takes three days to start, our formula no longer represents that situation. Add a dated availability schedule before presenting such a result. Do not quietly use the context-only normal lead time as an alternate-start delay.
Calculate cover without concealing missing data
Days of cover equals stock divided by positive daily demand. Supplier A has 300 units and uses 100 per day, so its cover is three days. The same calculation gives eight days for B, two for C, five for D, two for E and ten for F.
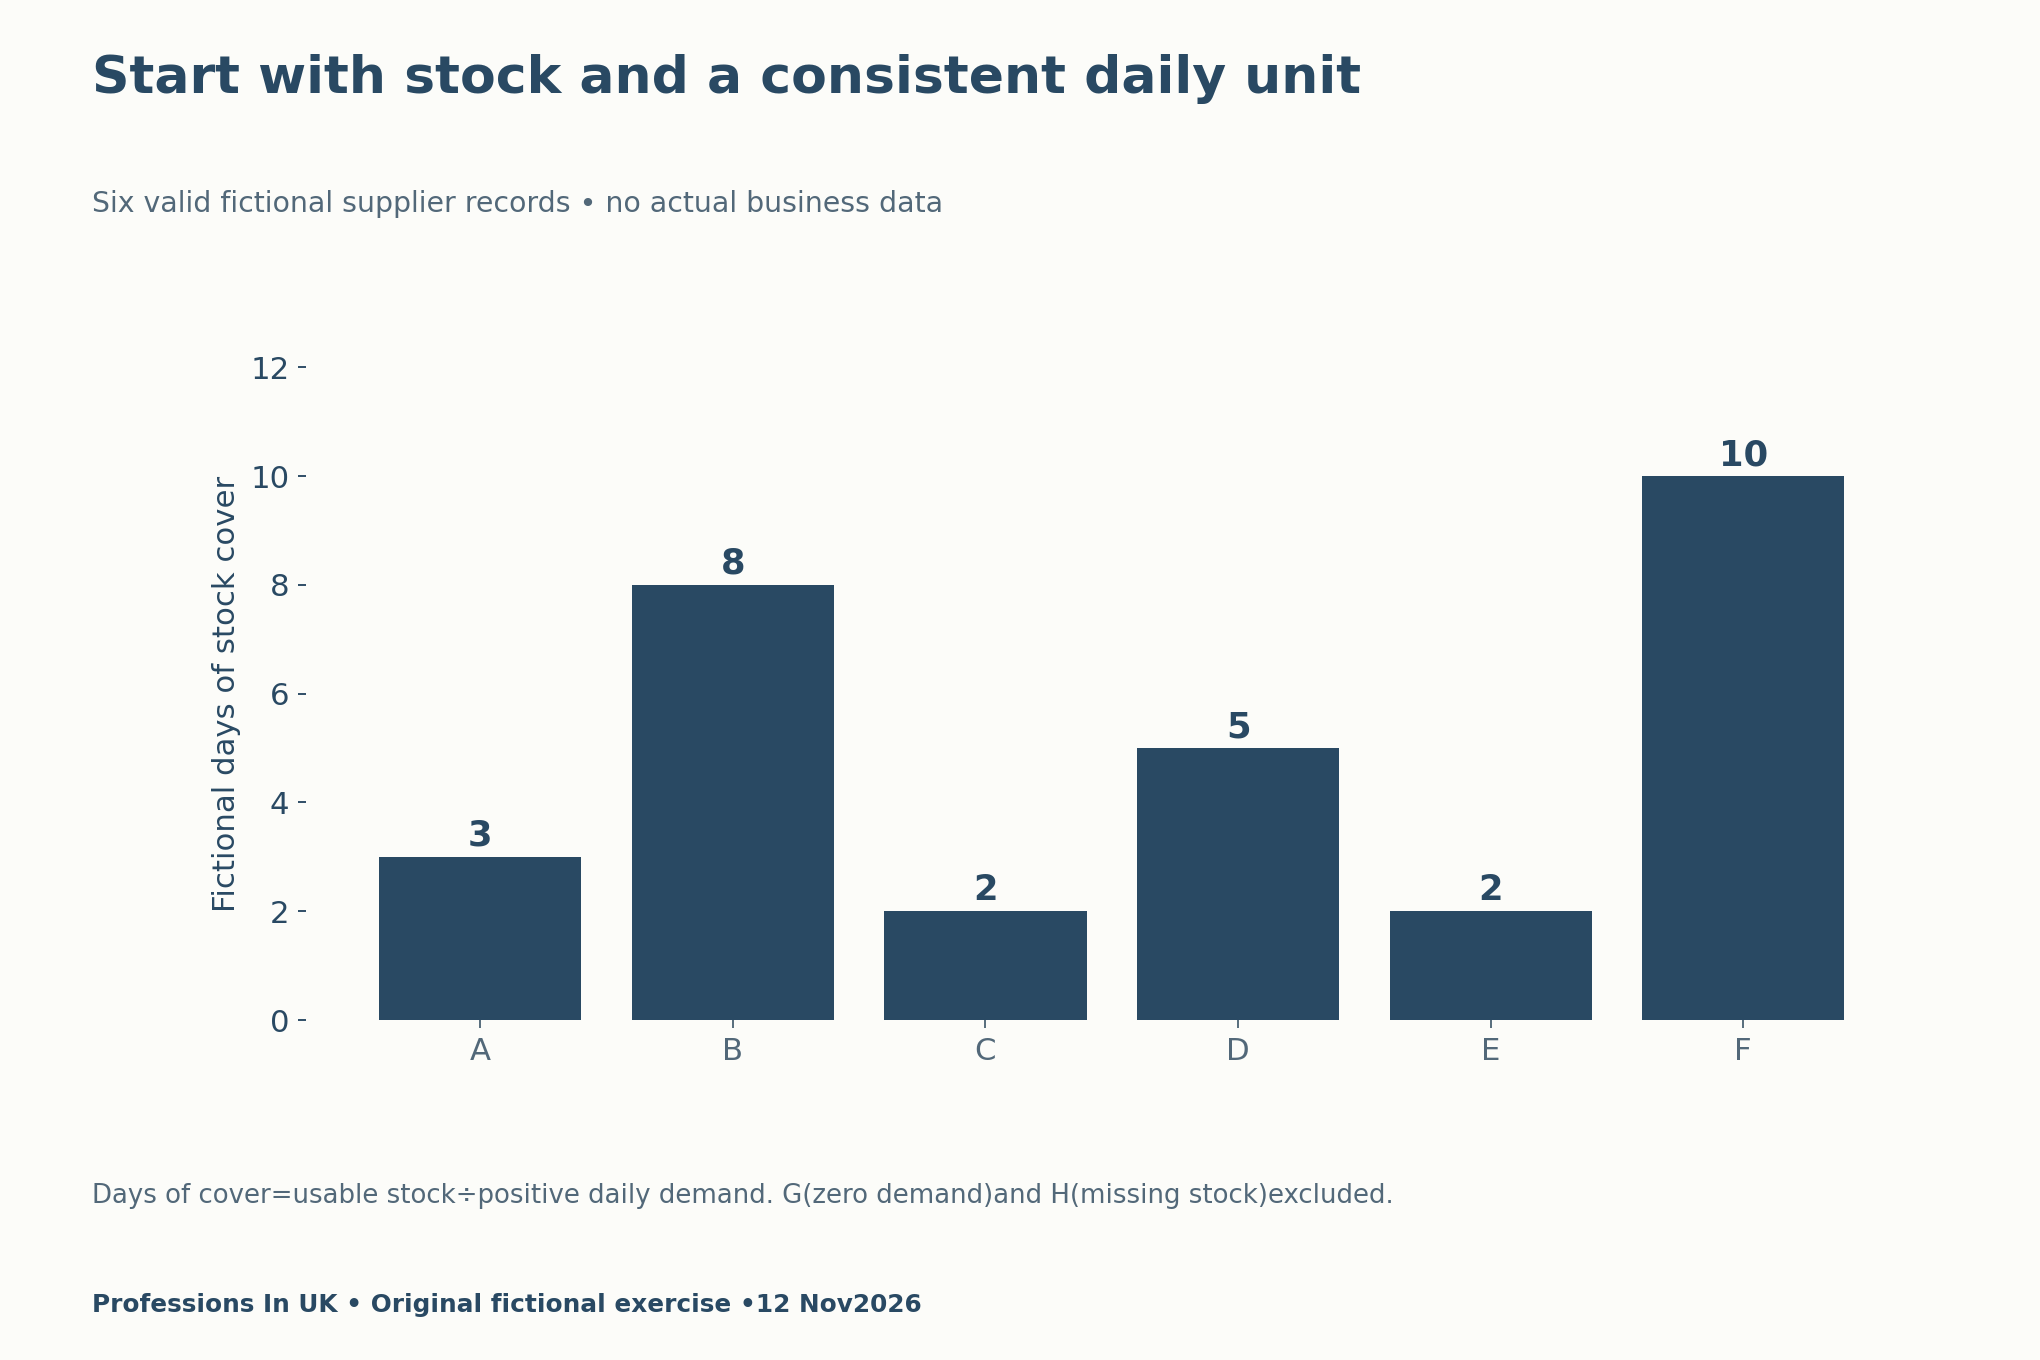
Supplier G has zero daily demand. Dividing by zero is undefined, so we do not assign unlimited cover or treat it as a successful resilience result. Supplier H lacks a stock figure. We leave its result uncalculated instead of replacing the missing value with zero. Both cases retain a status explaining the problem.
Compare assumed disruption durations
The baseline uses shortfall days=max(0,disruption days−stock cover). For A, a five-day interruption leaves two shortfall days after its three days of stock are used. This is a simplified duration of unmet demand, rather than a forecast of late orders or lost customers.
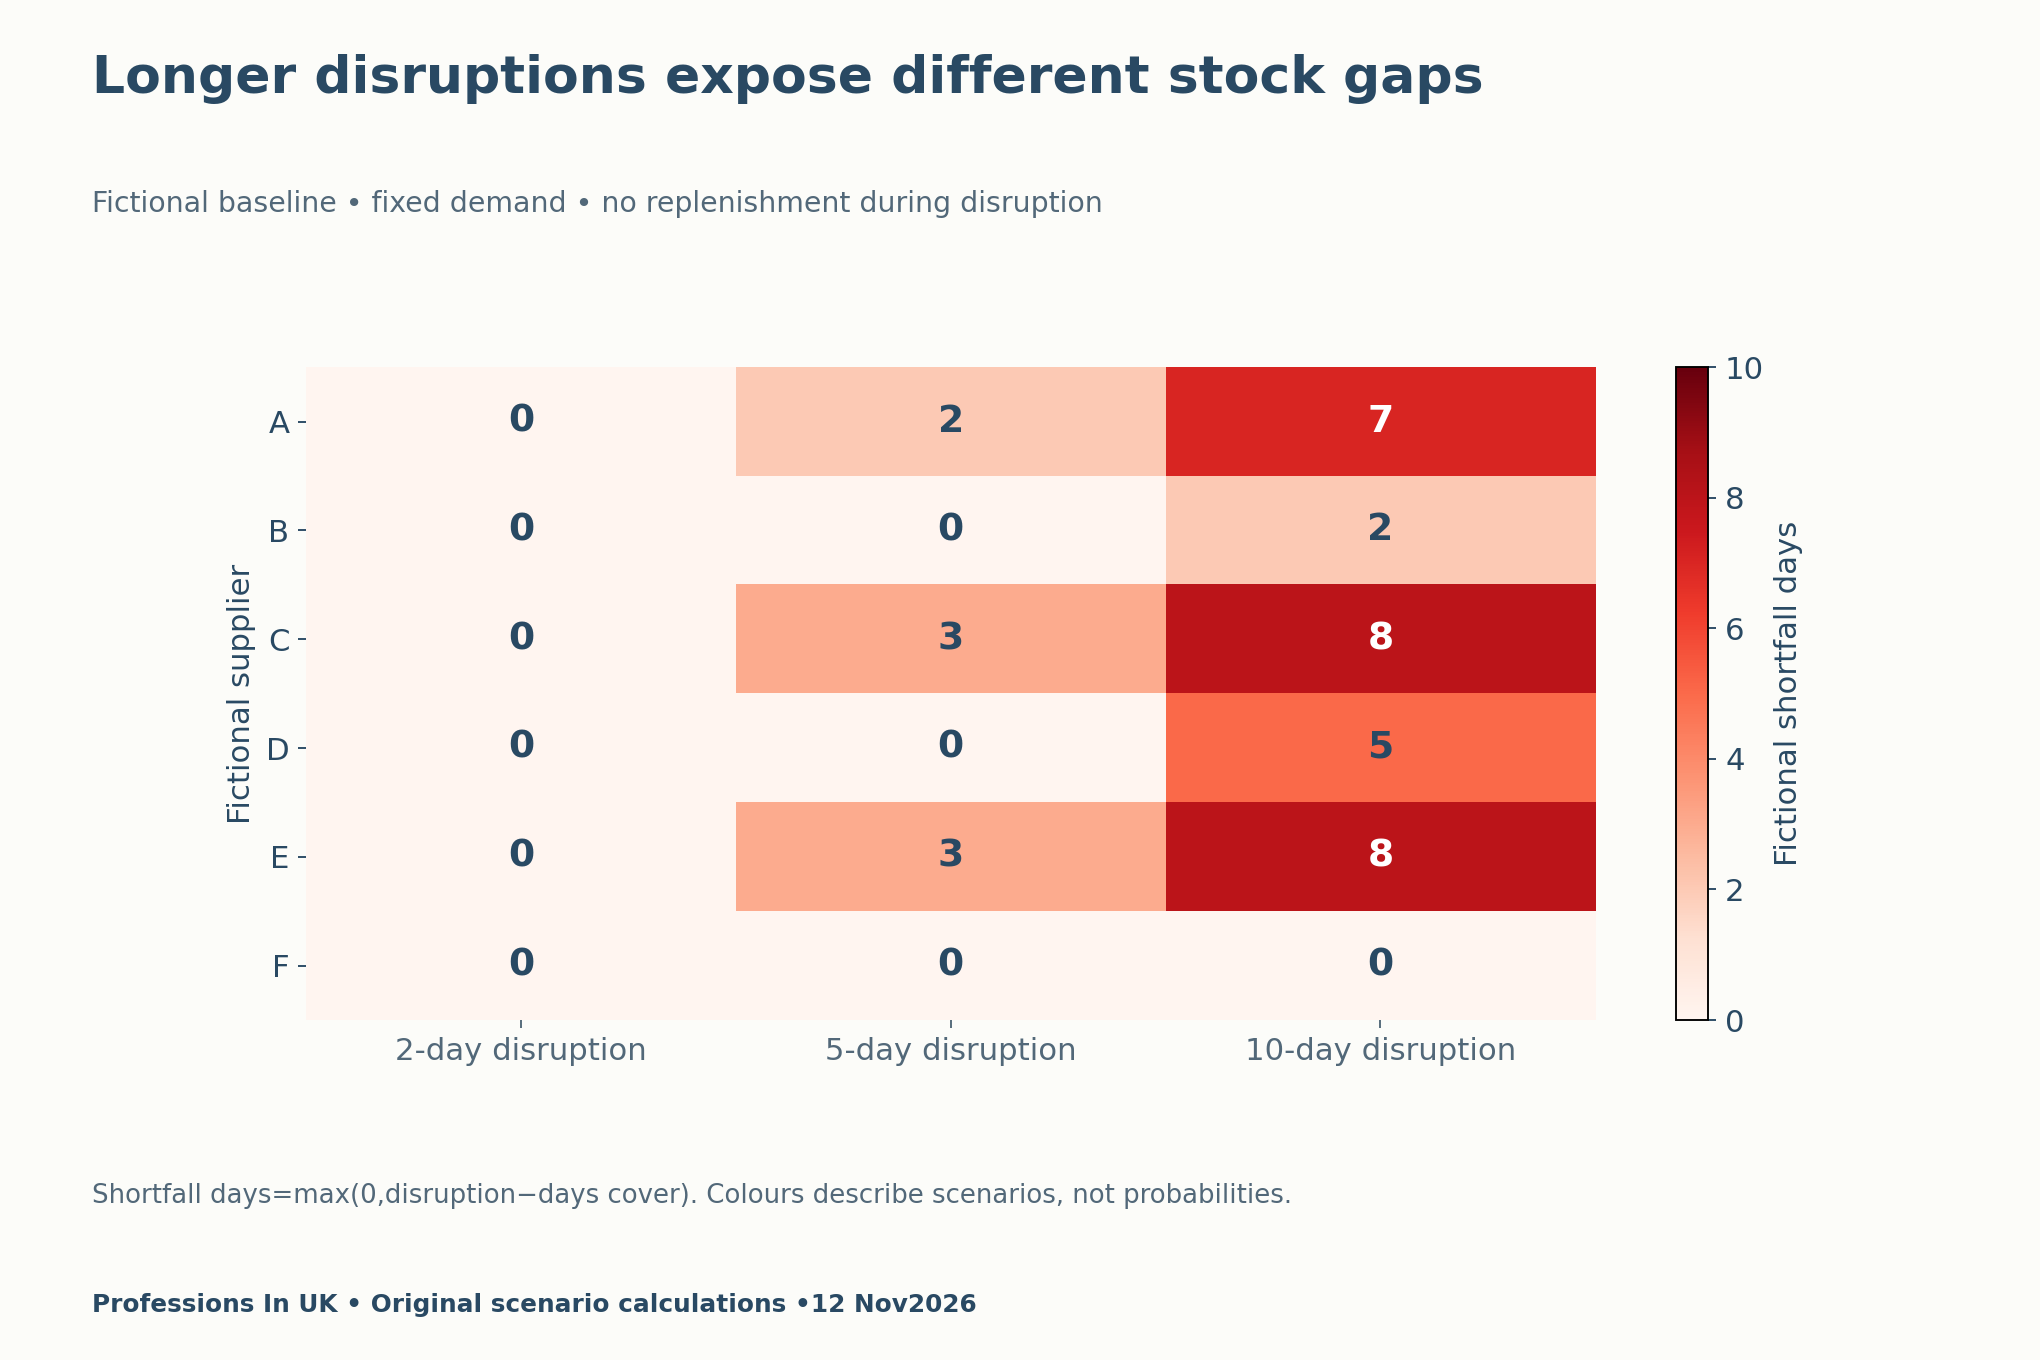
The results file preserves all twenty-four supplier-duration combinations, including the uncalculated G and H rows. Keeping those rows makes the exclusions auditable. It also prevents a chart of six convenient records from looking like a complete assessment of eight valid suppliers.
Test what alternate capacity actually changes
Baseline shortfall units=max(0,daily demand×disruption days−initial stock). Our alternate case replaces demand with net demand after the assumed alternate capacity. For A at ten days, the baseline is 100×10−300=700 units; the alternate case is(100−40)×10−300=300 units.
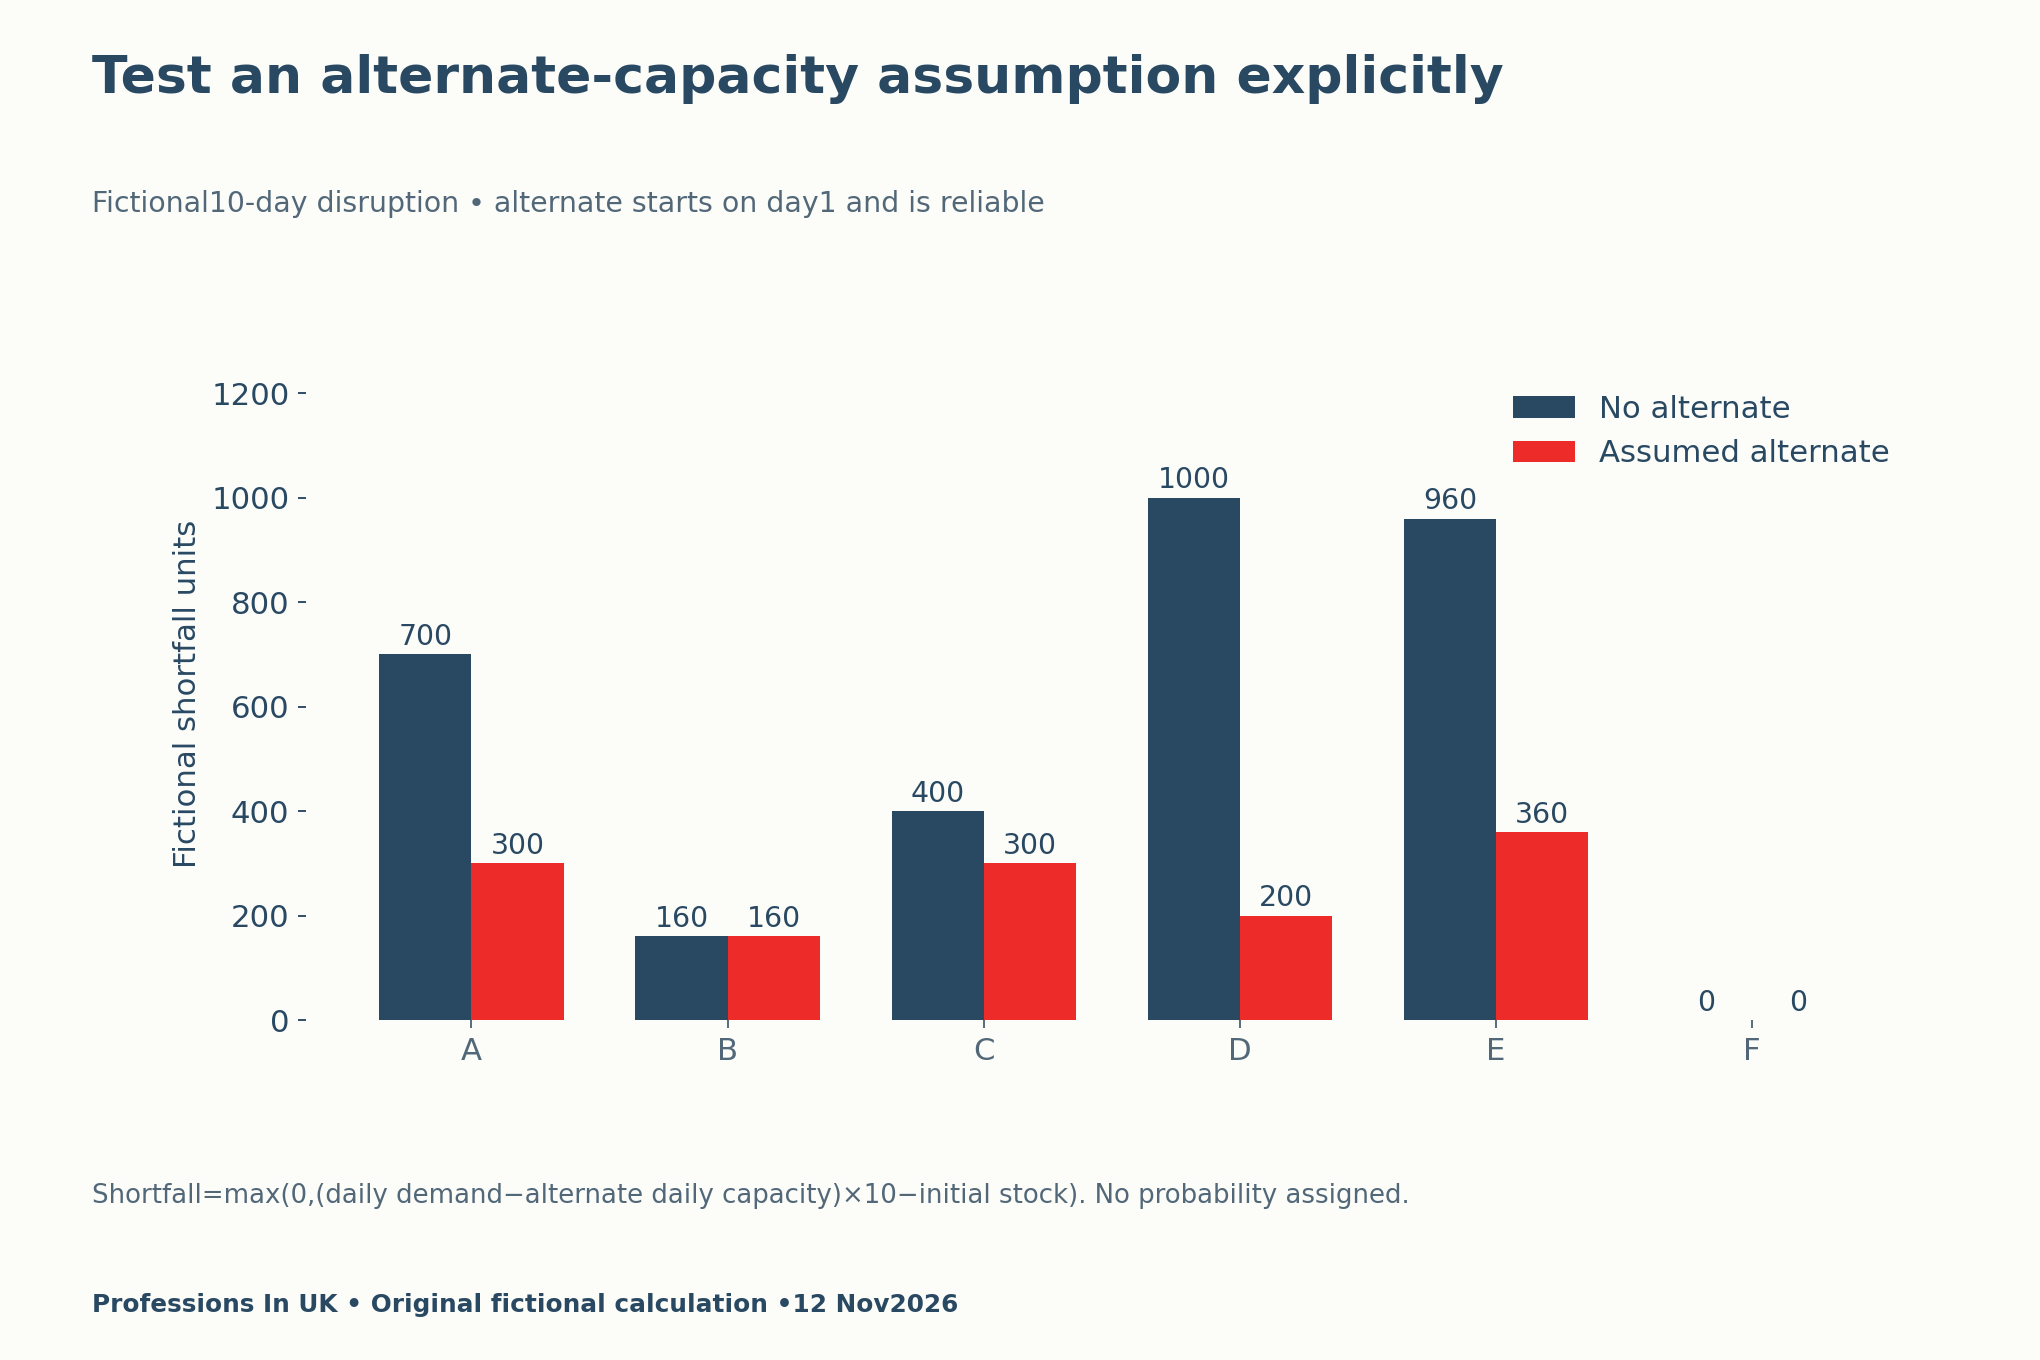
This comparison identifies which assumption deserves a check. It does not choose a supplier, authorise a purchase or estimate an avoided financial loss. Before applying a model at work, the relevant operational owner would need to verify availability, timing, compatibility and the decision’s wider constraints.
Personalized UK Career Consulting
Receive tailored career guidance designed just for you. Get actionable steps and expert support to boost your career in 1-3 days. Take control of your career now.
Get StartedWrite a decision memo another person can challenge
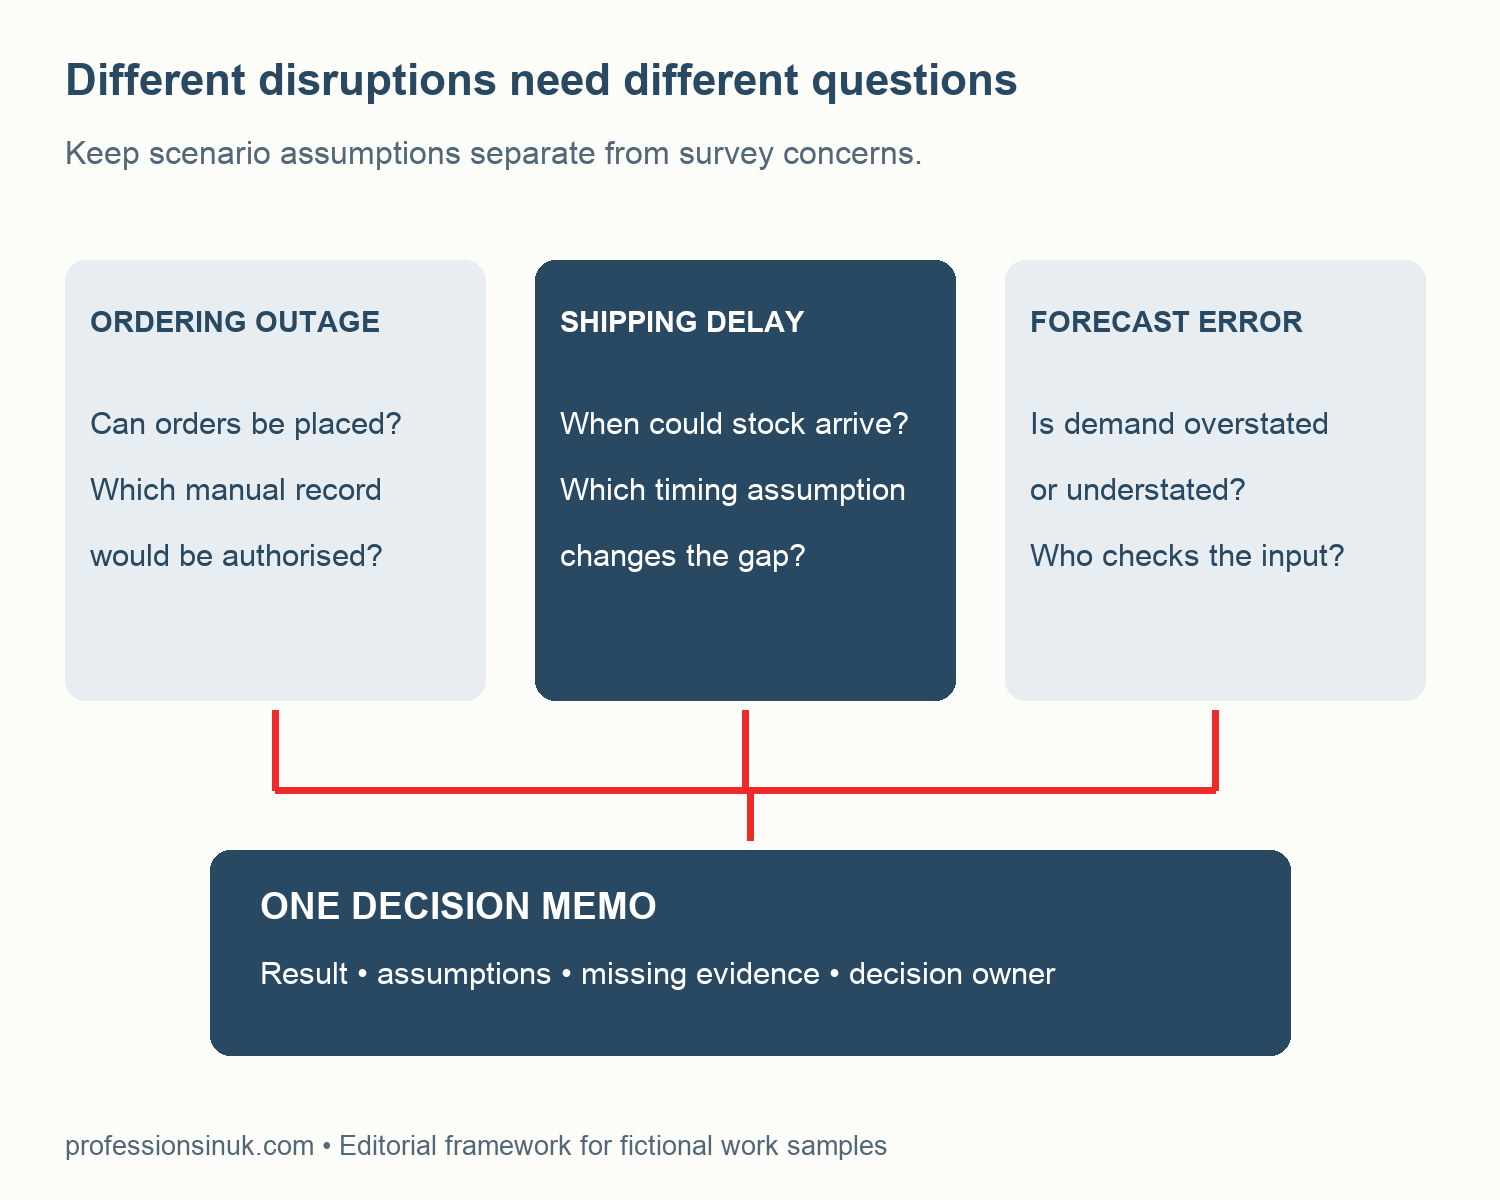
Keep the memo short enough to review. State the question, identify the fictional inputs and show the result with its unit. Then name the strongest assumptions and the missing evidence that could change the answer. A limitation beside the result is more useful than a vague warning at the end.
For example: “In the fictional ten-day case, A’s shortfall falls from 700 to 300 units if 40 alternate units arrive each day from day one. Availability and start timing are unverified assumptions. The next check is whether a comparable source could meet those conditions.” This communicates a conditional result without pretending to have secured capacity.
If you use the exercise in an application, explain your own contribution and retain the source citation. Our self-taught skills guide helps distinguish learning activity from evidence, while the IT vacancy-fit analysis keeps market headlines separate from the requirements of a specific role.
Download the reproducible files
- Selected ONS concern measures and dates (CSV)
- Eight fictional supplier inputs and assumptions (CSV)
- All 24 scenario rows and calculation statuses (CSV)
- Blank decision-memo and assumption register (CSV)
Methodology, calculation checks and limits
The source measures and the fictional model are separate files. We recalculated the concern differences and checked every scenario against its declared formula. Assertions verify the six ten-day baseline and alternate results, the twenty-four-row count and the retained blank outputs for zero-demand and missing-stock cases. The retained script can reproduce the files and figures.
The model uses no probabilities, prices or observed supplier records. It does not simulate recovery, queues, order prioritisation, spoilage, uncertain demand or simultaneous disruptions. Its purpose is to make a small piece of reasoning inspectable. Adding realistic complexity requires suitable evidence and further validation, rather than a more impressive-looking chart.
Suggested citation: Professions In UK (12 November 2026), “Supply Chain Analyst Portfolio UK: Model Disruption Clearly”, original fictional supplier exercise and tools, with ONS BICS 5 November 2026. Credit ONS separately for reused survey estimates.


