




UK science and engineering job adverts in 2026 point to questions worth investigating, rather than a reliable list of the best places to work. Our comparison keeps advertising volumes, year-on-year changes and source-quality warnings together. It covers 14 occupations, 12 regions or countries and the UK total.
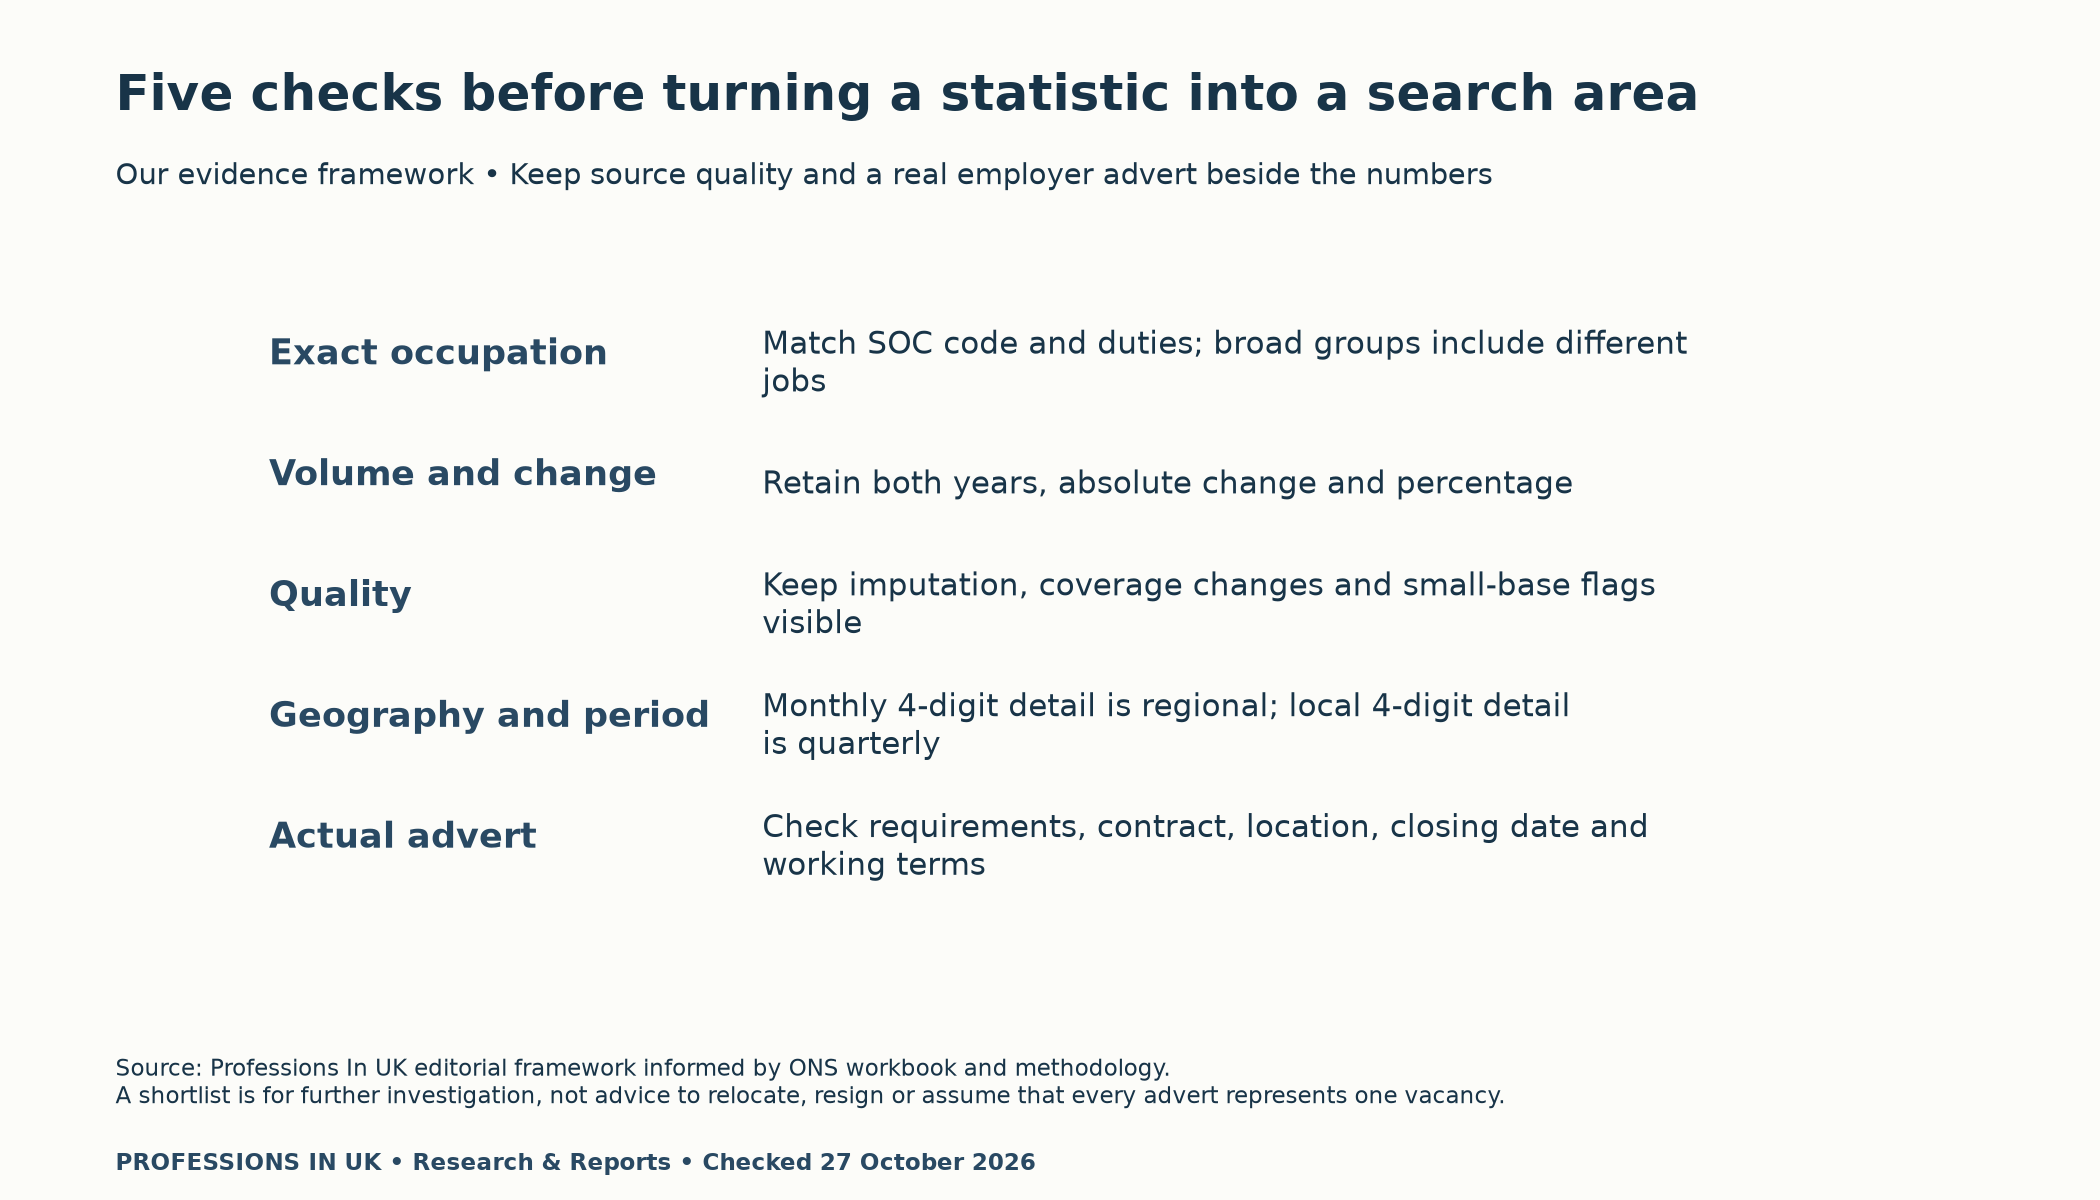
The practical lesson is simple: a larger percentage rise can represent fewer adverts. Moreover, changes in data coverage can affect the apparent trend. Use the figures to organise further searches, then check actual employer requirements, contract terms and application dates before making a commitment.
Edition: ONS data released 23 October 2026, comparing September 2026 with September 2025. Research checked 27 October. September 2026 is partially imputed, and the data are not seasonally adjusted.
What UK science and engineering job adverts in 2026 measure
The 22 October ONS bulletin reports new online adverts up 9% across all occupations compared with September 2025. The broad “Science, research, engineering and technology professionals” group rose 26%. Teaching and other educational professionals fell 17%.
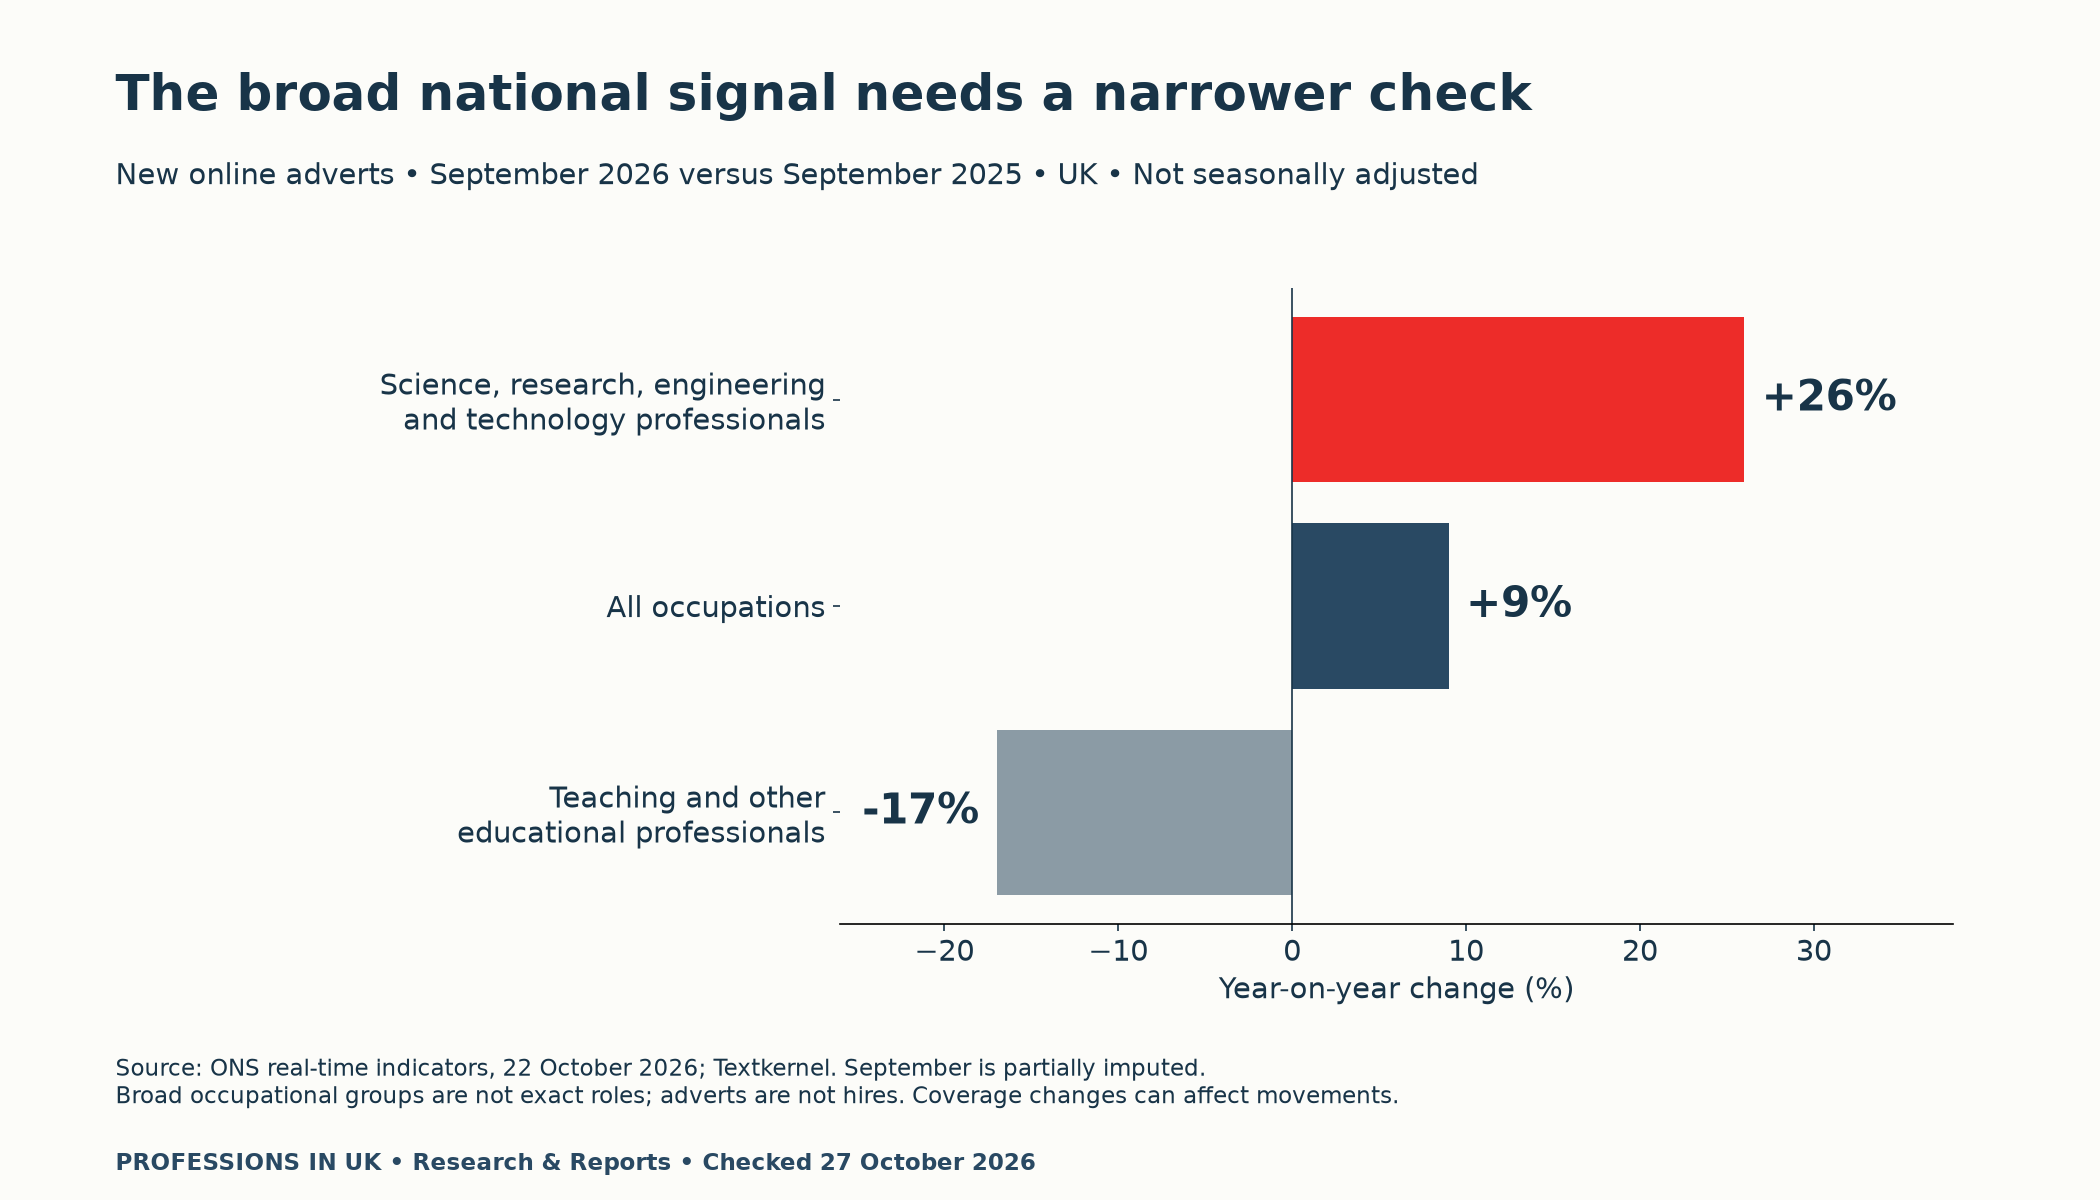
These are new adverts appearing during a month, not hires or a count of currently open jobs. The broad group also combines different occupations. Therefore, its 26% increase cannot establish a trend for your exact role or local area.
Likewise, the bulletin’s South East increase of 25% and East Midlands increase of 16% cover all occupations. They are not science-specific regional figures. We do not combine them with national occupational growth to manufacture a local result.
A reproducible comparison of 14 occupations
We used Table 3 of the 23 October labour-demand workbook. Before examining comparison values, we selected every four-digit SOC2020 code beginning 211 or 212. This covers six science occupations and eight engineering occupations. It excludes IT occupations and technicians, so it differs from the bulletin’s broader group.
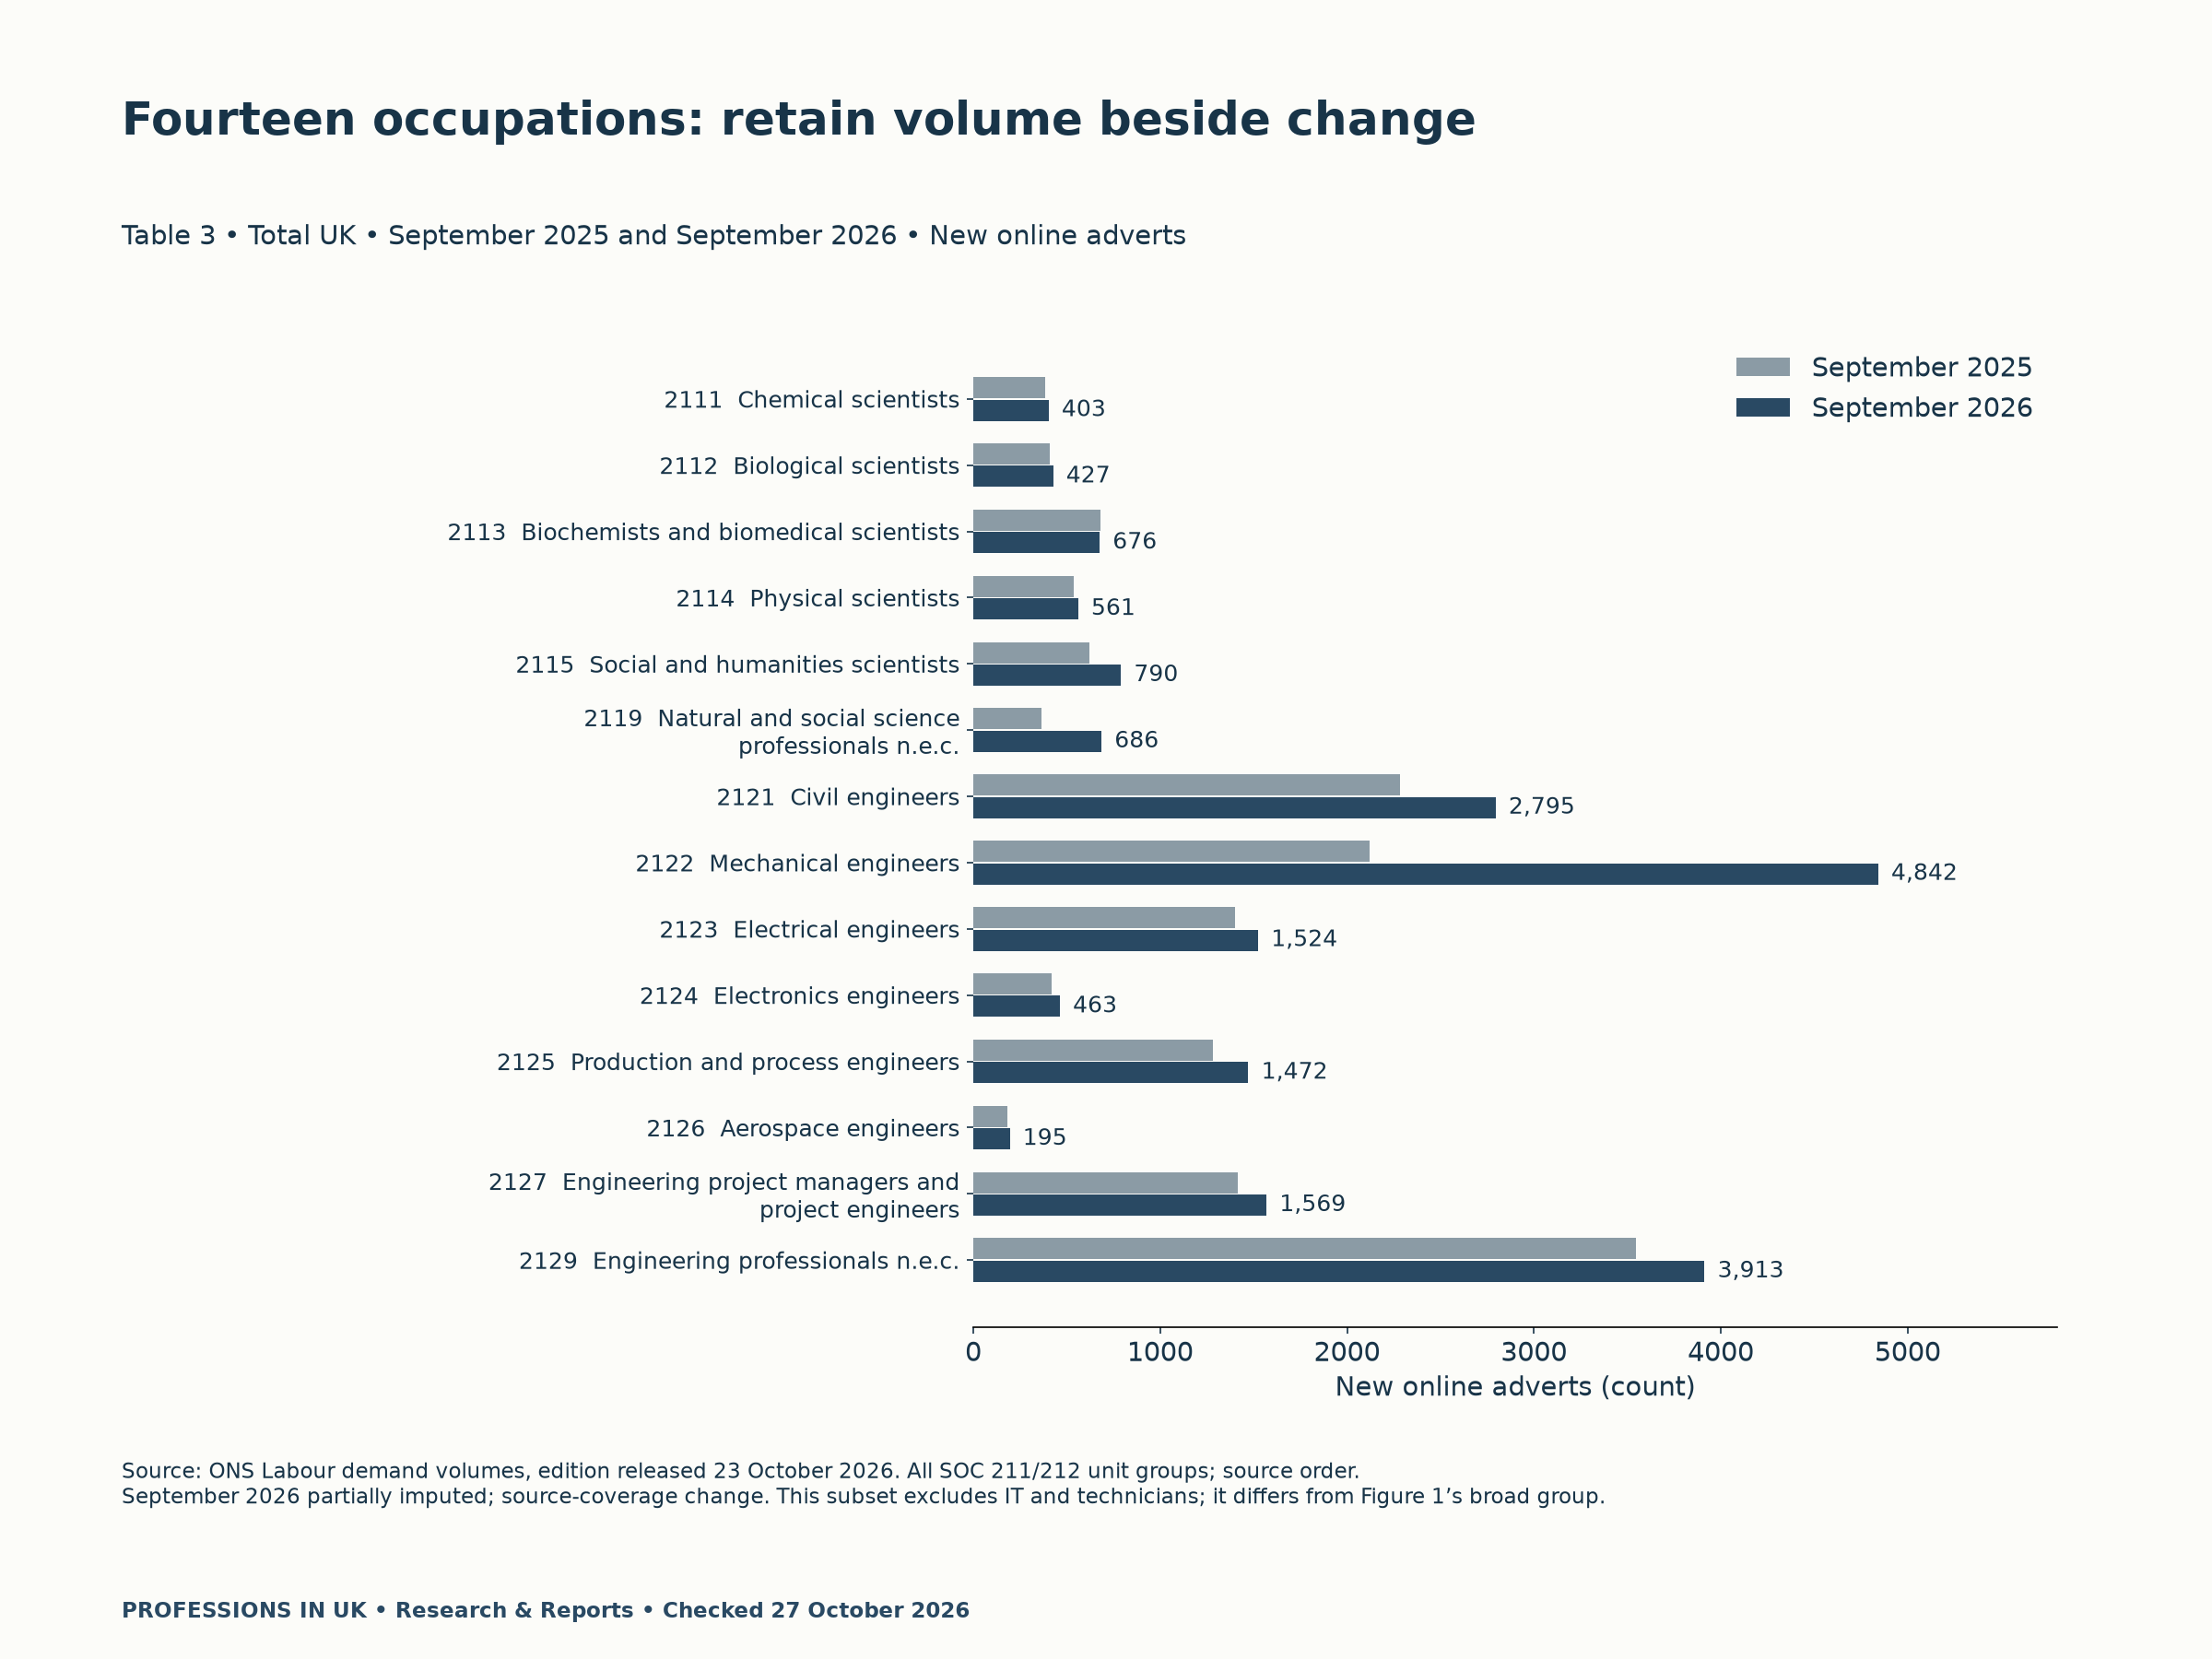
| SOC2020 | Occupation | Sep 2025 | Sep 2026 | Change |
|---|---|---|---|---|
| 2111 | Chemical scientists | 387 | 403 | +4.1% |
| 2112 | Biological scientists | 409 | 427 | +4.4% |
| 2113 | Biochemists and biomedical scientists | 683 | 676 | -1.0% |
| 2114 | Physical scientists | 537 | 561 | +4.5% |
| 2115 | Social and humanities scientists | 620 | 790 | +27.4% |
| 2119 | Natural and social science professionals n.e.c. | 365 | 686 | +87.9% |
| 2121 | Civil engineers | 2,282 | 2,795 | +22.5% |
| 2122 | Mechanical engineers | 2,120 | 4,842 | +128.4% |
| 2123 | Electrical engineers | 1,402 | 1,524 | +8.7% |
| 2124 | Electronics engineers | 421 | 463 | +10.0% |
| 2125 | Production and process engineers | 1,284 | 1,472 | +14.6% |
| 2126 | Aerospace engineers | 183 | 195 | +6.6% |
| 2127 | Engineering project managers and project engineers | 1,414 | 1,569 | +11.0% |
| 2129 | Engineering professionals n.e.c. | 3,544 | 3,913 | +10.4% |
The downloadable comparison retains all 182 occupation-geography pairs: 14 occupations across the UK total and 12 ITL1 regions or countries. We use each source UK total directly. Regional allocations do not always sum exactly to it, so we do not replace the national value with a regional sum.
For example, mechanical-engineer adverts rise from 2,120 to 4,842, an increase of 2,722 or 128.4%. That calculation is reproducible. However, it is not evidence that employers hired 128.4% more people. The source-coverage and imputation warnings are essential to its interpretation.
Keep the quality warnings beside the growth
The detailed workbook warns that a large source’s level changed in September. It also gives a South East coverage-volatility caution. Consequently, the sharp increase for South East mechanical engineers—from 304 to 1,592—must not become an unqualified claim about a hiring boom.
There is also a difference in the timing descriptions. The bulletin says June–September 2026 was partially imputed, while the detailed workbook says July–September. Both flag September. We retain this difference instead of choosing one description silently. The workbook also documents suppression and other source issues in earlier months.
All 182 selected September pairs are numeric, with no zero baselines or suppressed cells in this extract. That does not remove the wider quality limits. We flag a 2025 count below 100 as an editorial small-base warning; it is not an ONS reliability threshold. This applies to 116 of the 168 regional pairs.
Use volume and growth to ask different questions
For a closer regional view, we selected civil, mechanical and electrical engineers before inspecting their results. Figure 3 shows all 12 regions or countries for each occupation. Volume asks how many adverts the source recorded; growth asks how that count changed. Neither establishes whether the available work fits you.
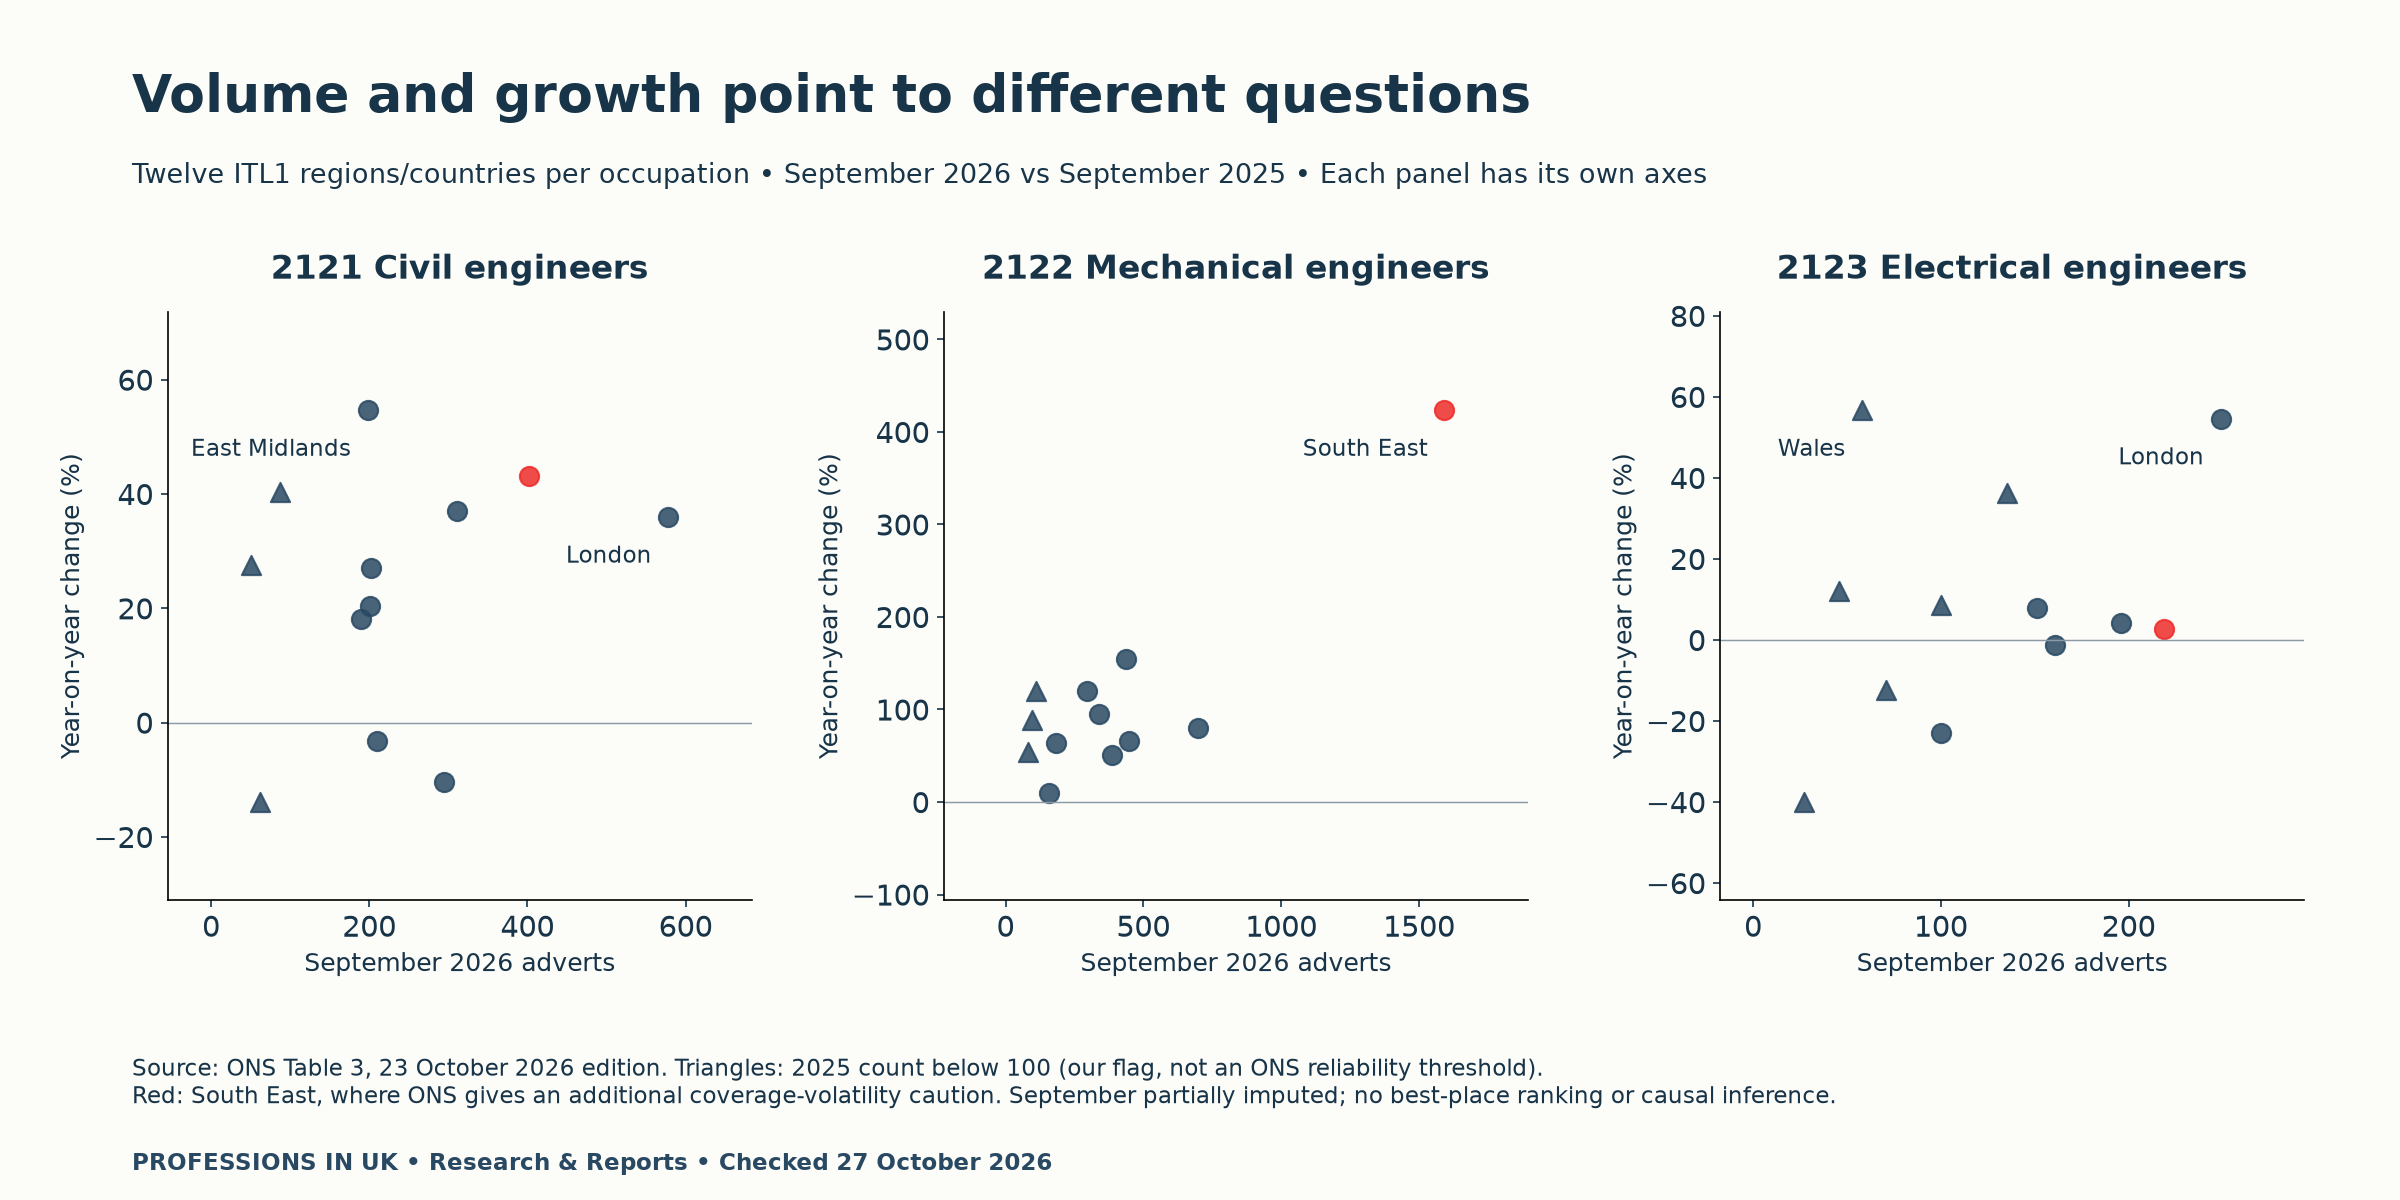
London records the largest selected civil-engineer volume at 578, while the East Midlands has the highest percentage increase for that occupation, at 54.7% from 128 to 198. These are different observations, not competing claims about the best location.
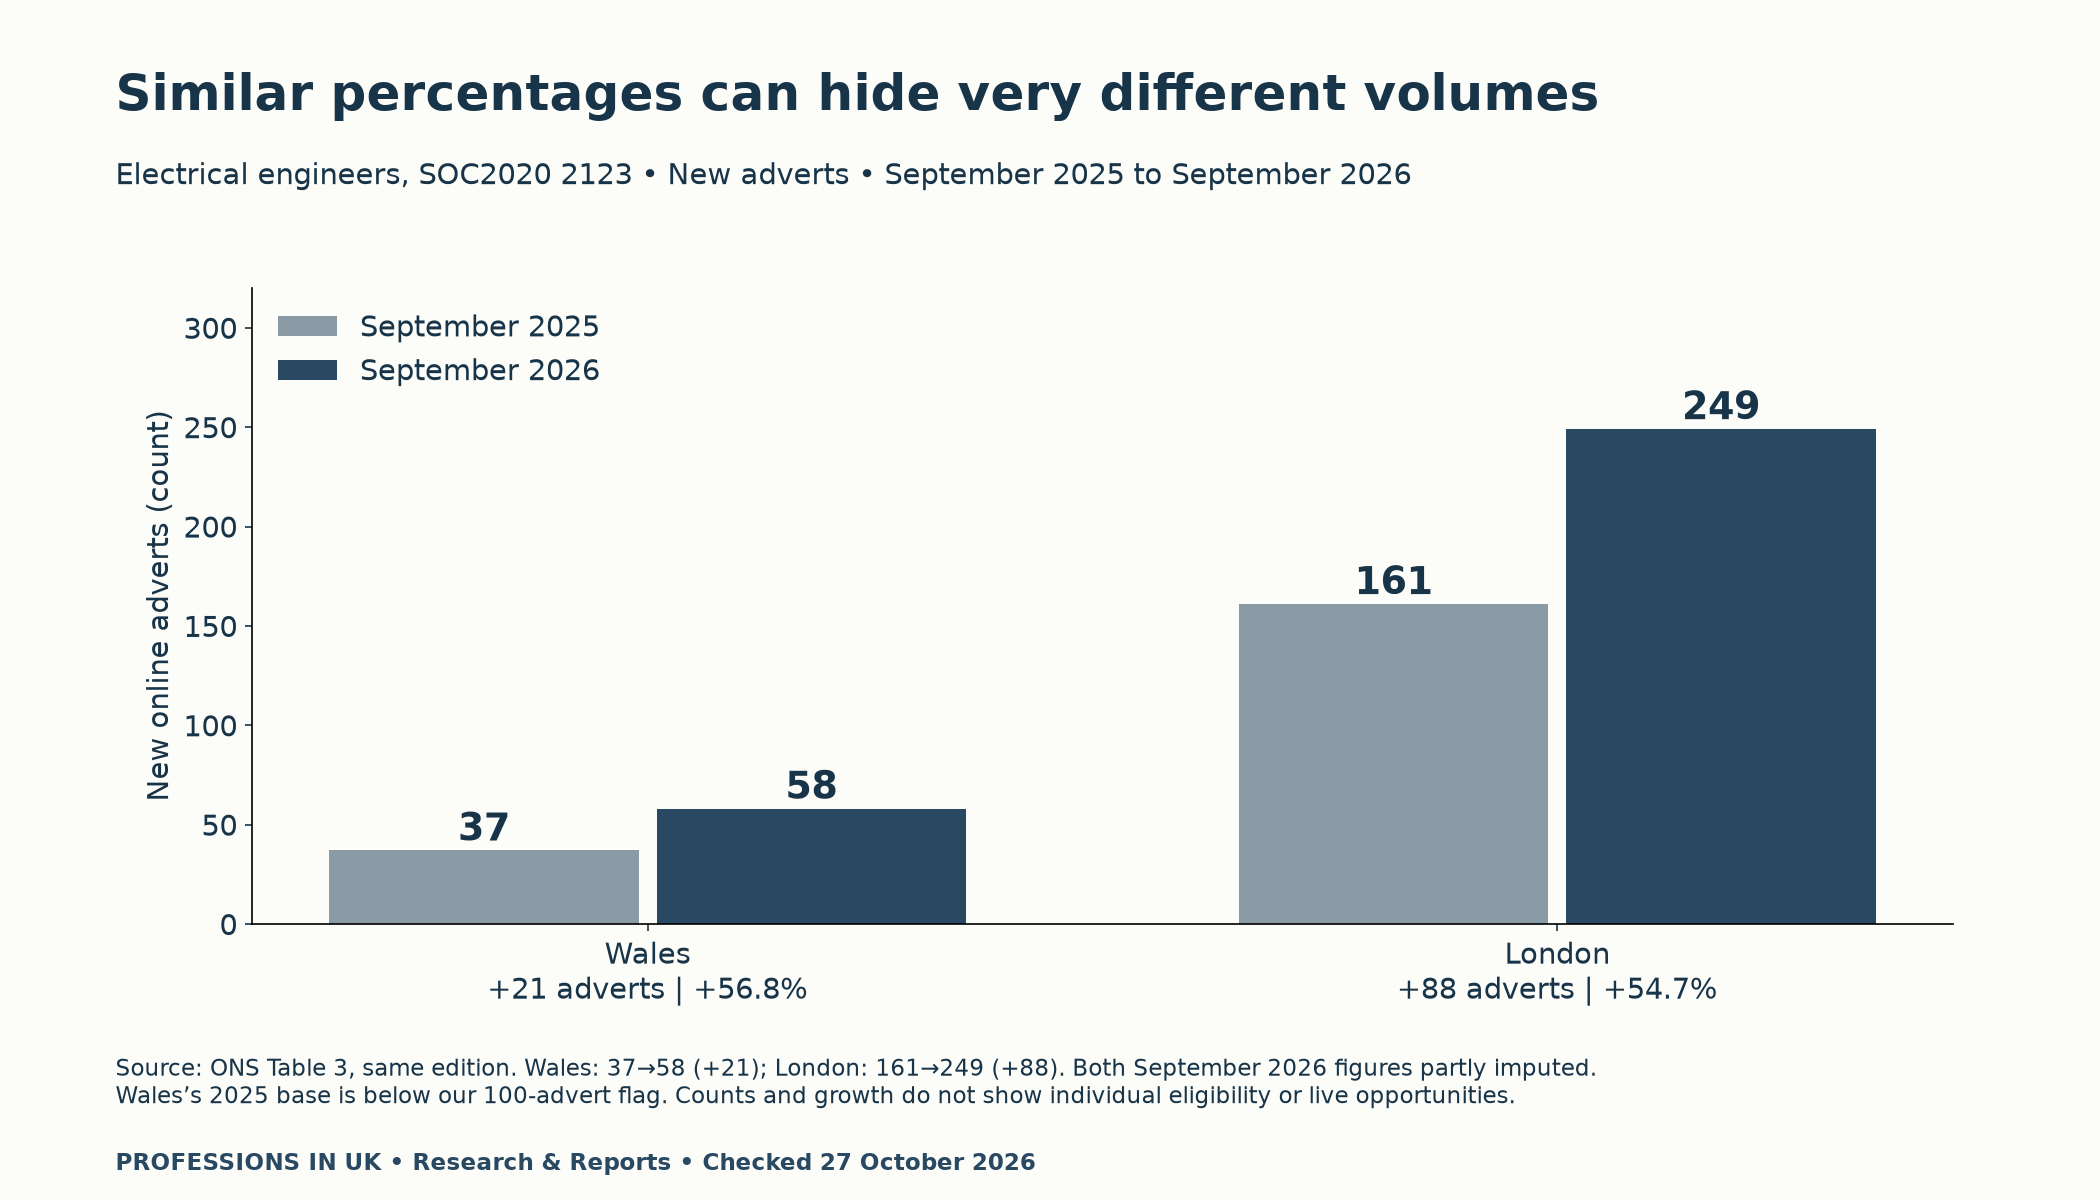
The electrical-engineer example makes the base effect clearer. Wales rises from 37 to 58 adverts: 21 more, or 56.8%. London rises from 161 to 249: 88 more, or 54.7%. Wales has the larger percentage change but fewer recorded adverts in both years. Both September 2026 values remain partially imputed.
Personalized UK Career Consulting
Receive tailored career guidance designed just for you. Get actionable steps and expert support to boost your career in 1-3 days. Take control of your career now.
Get Started
Check the occupation, geography and period
The workbook offers different levels of detail. Table 3 provides monthly four-digit occupations by region. Table 4 provides monthly three-digit occupations by local authority. Four-digit local-authority detail is quarterly in Table 5. A quarterly local figure must not be labelled as a September monthly count.
The ONS methodology explains occupation matching, geographic allocation and deduplication. These processes have limits. Some adverts may be speculative or cover several positions, while some recruitment never appears online. Job titles can also be assigned to an imperfect occupational match.
Two live employer examples show the next check
We separately checked two employer pages on 27 October. They illustrate how to investigate current opportunities; they do not validate September’s counts. We have not assigned these adverts to the ONS occupation codes or treated them as a representative vacancy sample.
- Cambridge materials-engineering research assistant, NM51485: located in Central Cambridge, with funding initially available for four months. The employer expects at least a relevant bachelor’s degree and laboratory/data-analysis skills; a master’s is preferred. The displayed deadline is 6 November.
- Manchester solid-state NMR research associate, SAE-032399: a full-time, 36-month fixed-term role. It requires a relevant PhD and advanced NMR experience. The displayed deadline is 31 October. A general hybrid-working policy link does not confirm a hybrid arrangement for this laboratory role.
Before applying, recheck the full specification, working terms and deadline on the employer’s site. For newcomers, confirm the employer’s stated work-authorisation requirements rather than assuming sponsorship. These examples also show why contract length and essential skills matter alongside a regional advert count.
Turn UK science and engineering job adverts in 2026 into a search log
- 182-row science and engineering advert comparison with quality flags (CSV)
- Blank private science and engineering job-search log (CSV)
Record the exact occupation, both counts, source edition and quality warning. Then add a real employer advert, its requirements and a next action. Our construction evidence audit offers a fuller requirements-checking example, while the entry-route guide separates policy announcements from open applications.
Methodology, reuse and limits
All comparisons use the same workbook edition and matched region/SOC codes. Change equals the 2026 count minus the 2025 count; percentage change divides that difference by the 2025 count. We preserve source labels, calculate before rounding and exclude the UK aggregate from regional comparisons. The retained script checks 182 unique keys.
Contains public sector information licensed under the Open Government Licence v3.0. Cite: Professions In UK, analysis of ONS Table 3, January 2017–September 2026 edition, released 23 October 2026; checked 27 October 2026. These official statistics in development support investigation, not a statistically robust place ranking, an applicant-success forecast or advice to relocate or resign.


